Back to Post-publication discussions

1
A study of stereotype accuracy in the Netherlands: immigrant crime, occupational sex distribution, and provincial income inequality

Submission status
Published

Submission Editor
Noah Carl

Authors
Emil O. W. Kirkegaard
Arjen Gerritsen

Title
A study of stereotype accuracy in the Netherlands: immigrant crime, occupational sex distribution, and provincial income inequality

Abstract

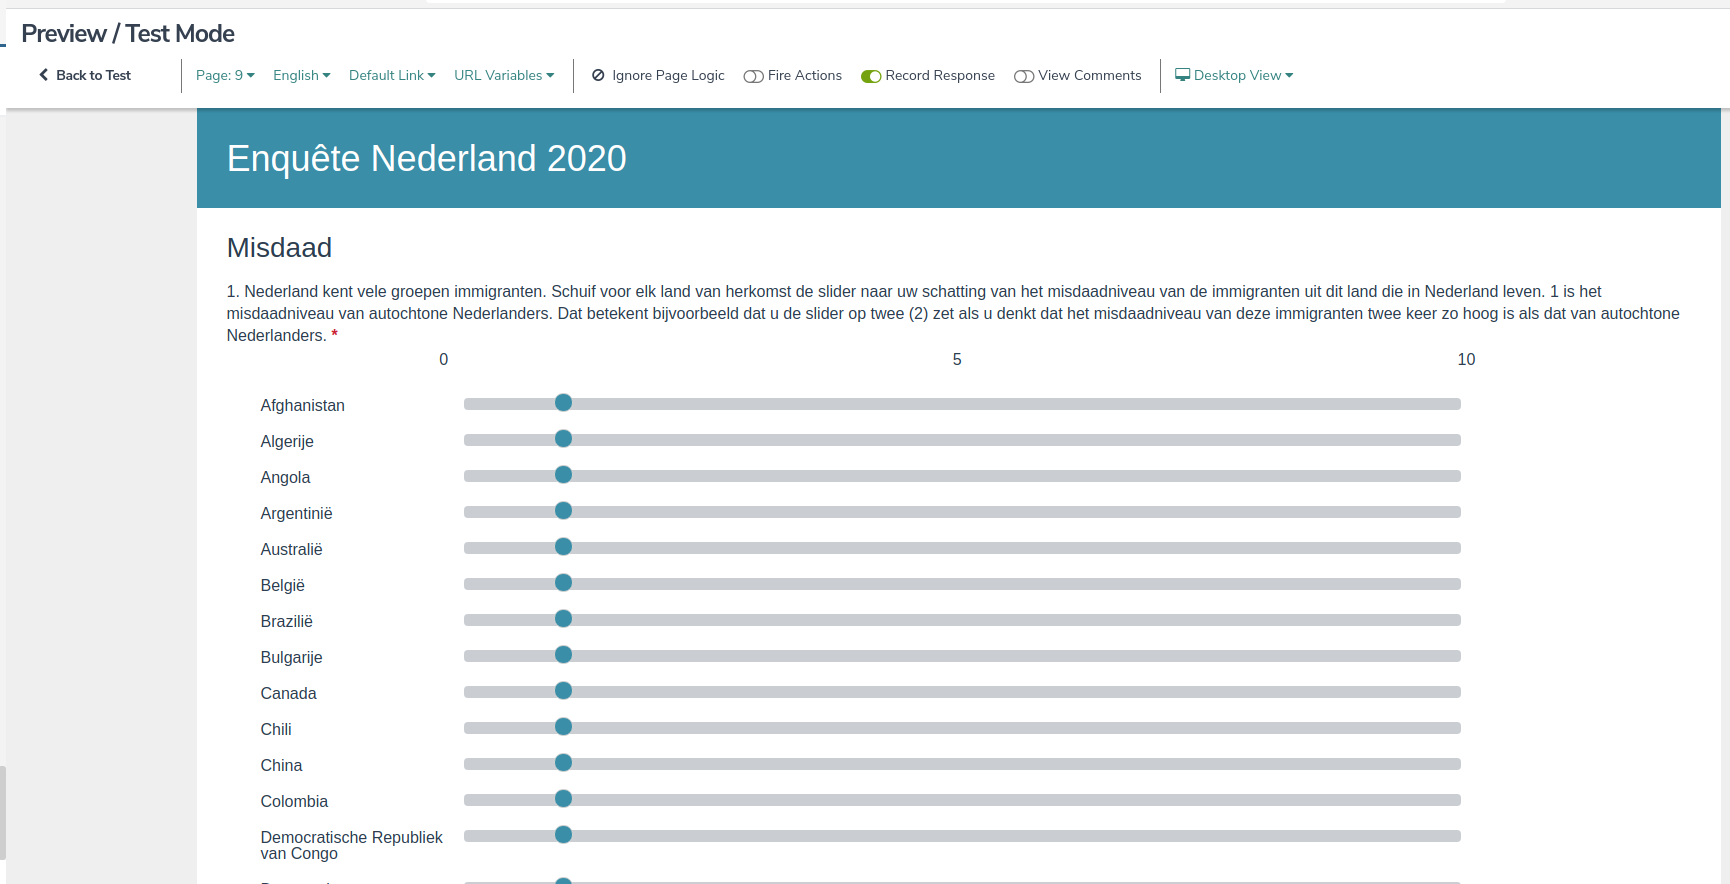
In this pre-registered study, we gathered two online samples totaling 615 subjects. The first sample was nationally representative with regards to age, sex and education, the second was an online convenience sample with mostly younger people. We measured intelligence (vocabulary and science knowledge, 20 items each) using newly constructed Dutch language tests. We measured stereotypes in three domains: 68 national origin-based immigrant crime rates, 54 occupational sex distributions, and 12 provincial incomes. We additionally measured other covariates such as employment status and political voting behaviors.

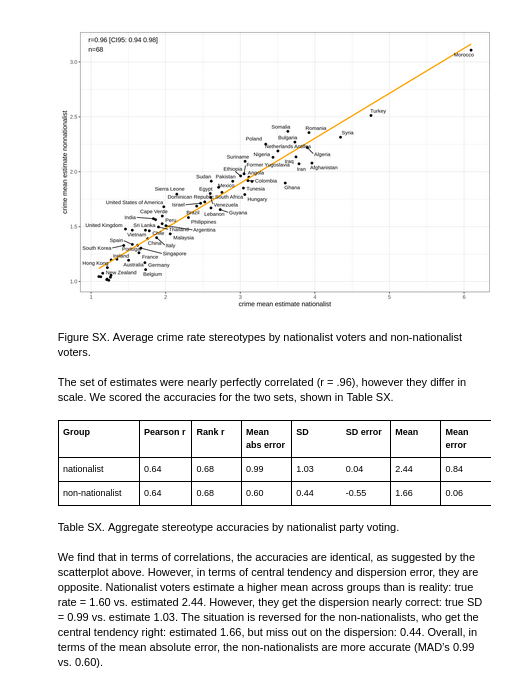
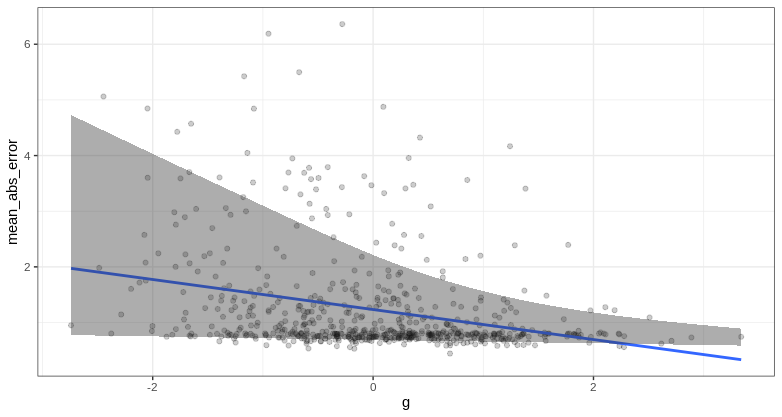
Results showed substantial stereotype accuracy for each domain. Aggregate (average) stereotype Pearson correlation accuracies were strong: immigrant crime .65, occupations .94, and provincial incomes .85. Results of individual accuracies found there was a weak general factor of stereotype accuracy measures, reflecting a general social perception ability. We found that intelligence moderately but robustly predicted more accurate stereotypes across domains as well as general stereotyping ability (r’s .20, .25, .26, .39, β’s 0.17, 0.25, 0.21, 0.37 from the full regression models). Other variables did not have robust effects across all domains, but had some reliable effects for one or two domains.

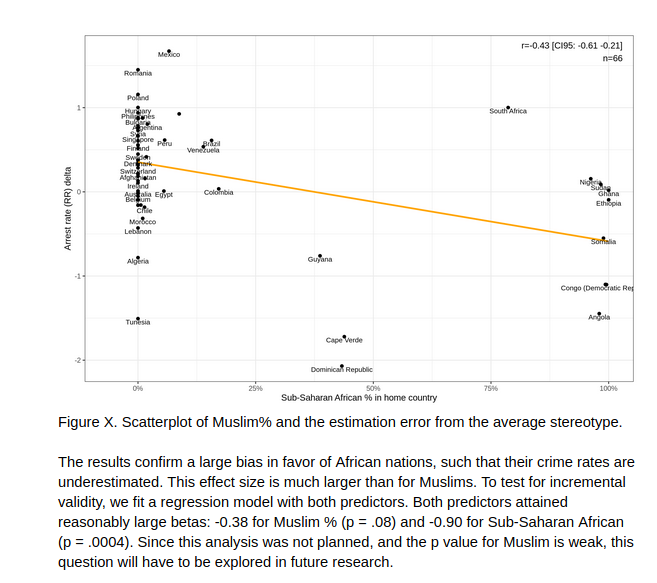
For immigrant crime rates, we also measured the immigration preferences for the same groups, i.e. whether people would like more or fewer people from these groups. We find that actual crime rates predict net opposition at r = .55, i.e., subjects were more hostile to immigration from origins that had higher crime rates. We examined a rational immigration preference path model where actual crime rates→stereotypes of crime rates→immigrant preferences. We found that about 84% of the effect of crime rates was mediated this way, and this result was obtained whether or not one included Muslim% as a covariate in the model. Overall, our results support rational models of social perception and policy preferences for immigration.

Keywords
intelligence, cognitive ability, stereotype accuracy, immigrants, inequality, the Netherlands, Islam, immigration, preregistered, Muslim, vocabulary, science knowledge, provinces, gender, sex

Supplemental materials link
https://osf.io/aexk9/

Planned Analyses
https://osf.io/8qhmr/

Pdf

Paper

Typeset Pdf

Typeset Paper

Reviewers ( 0 / 0 / 3 )
Peter Frost: Accept
Dr. g: Accept
Gerhard Meisenberg: Accept
Public Note
Dear reviewers, The paper is quite long, 21k words with references. This is because we decided to keep everything in a single paper instead of splitting it. Our questionnaire and set of planned analyses were many, so this resulted in the long, but hopefully, informative paper.

Fri 05 Feb 2021 17:30

Reviewer

Emil,

Is it pro-Muslim bias or pro-Black bias? On p. 49 "Scatterplot of Muslim% and the estimation error from the average stereotype," your graph actually shows a tendency to overestimate the criminality of immigrants from Indonesia, Syria, Turkey, and Pakistan — all of which are Muslim countries. The pro-Muslim bias exists only for immigrants from North Africa and Somalia, i.e., Muslims who, to varying degrees, are categorized as "Black" by native Dutch people.

The same pro-Black bias can be seen on the left-side of your graph. On the one hand, the Dutch respondents overestimate the criminality of immigrants from Mexico, Romania, Poland, Hungary, the Philippines, China, and Argentina. On the other hand, they underestimate the criminality of immigrants from Guyana, Suriname, Congo, Angola, Cape Verde, the Netherlands Antilles, and the Dominican Republic.

Do you see the pattern? I see a very strong pro-Black bias in your data. The pro-Muslim bias is less consistent and may simply be an artifact of that bias, i.e., most Muslim immigrants come from North Africa or Somalia. I also see an anti-Roma bias. The respondents overestimated the criminality of immigrants from Romania, Poland, and Bulgaria.

Would it be possible to have two versions of this graph by political tendency? In other words, one graph showing how nationalist voters estimate the criminality of immigrant groups and another graph showing how other voters estimate the criminality of immigrant groups.

Reviewer

I'd like to review this paper on my blog. Is that possible? The post is pasted below:


The crime news is unfair to Negroes, on the one hand, in that it emphasizes individual cases instead of statistical proportions [...] and, on the other hand, in that all other aspects of Negro life are neglected in the white press which gives the unfavorable crime news an undue weight. Sometimes the white press "creates" a Negro crime wave where none actually exists. (Myrdal 1944, pp. 655-656)

Gunnar Myrdal wrote his classic An American Dilemma during the early years of the civil rights movement. His reasoning won over many young people at university, particularly his argument that race prejudice was causing White Americans to exaggerate the negative aspects of Black Americans, particularly their crime rate.

Myrdal himself described how and why Blacks get wrongly accused:

The popular belief that all Negroes are inherently criminal operates to increase arrests, and the Negro's lack of political power prevents a white policeman from worrying about how many Negro arrests he makes. Some white criminals have made use of these prejudices to divert suspicion away from themselves onto Negroes: for example, there are many documented cases of white robbers blackening their faces when committing crimes. (Myrdal 1944, p. 968)

The theme of the "framed Black man" would be central to an award-winning work of fiction, To Kill a Mockingbird. Since its publication in 1960 it has never been out of print. In 2006, that book was most often mentioned when British librarians were asked: "Which book should every adult read before they die?" (Pauli 2006). Thus, for at least the past six decades educated White Americans have internalized a reflex of downplaying reports of crime by Black Americans, seeing such reports as exaggerated, if not outright false.

This reflex has spread not only within the United States but also to the rest of the English-speaking world-in fact, to all countries where English is widely used, particularly among the university-educated. The English language has been a key medium for the spread of ideas, even to countries that had neither black slavery nor Jim Crow, nor even a substantial African minority until recent times.


Public perceptions of criminality in the Netherlands

One such country is the Netherlands. In a recent survey, 615 Dutch adults were asked the following question:

There are many different immigrant groups in the Netherlands. For each of the groups, adjust the slider to your estimation of the crime rate relative to Dutch natives. This means you should adjust the slider to two (2) if you think the crime rate of this group is twice that of natives.

The actual crime rate of each immigrant group can be calculated from public data published by the government. It is thus possible to see how much the Dutch respondents overestimated or underestimated the criminality of each immigrant group. The respondents were chosen by two polling firms. A little over two-thirds of them came from a firm that skewed toward selecting younger and more university-educated respondents.

The findings are shown in the graph below. On the y-axis, the crime rate is overestimated at values higher than zero and underestimated at values lower than zero. The x-axis shows the percentage of Muslims in the immigrants' home country.

SEE FIGURE ON PAGE 22 OF THE PAPER

Kirkegaard and Gerritsen (2021, p. 21) argue that the results show a pro-Muslim bias, i.e., the respondents tended to underestimate the crime rate of Muslim immigrants, specifically "by 0.52 for more Muslim groups as compared to the less Muslim groups."

If you look closely at the graph, however, you will notice that the bias was not favorable toward all Muslims. In fact, the respondents overestimated the crime rate of immigrants from Afghanistan and accurately estimated the crime rate of immigrants from Indonesia and Pakistan. Perhaps more importantly, there was much more variation in bias when the respondents were estimating the crime rate of non-Muslim immigrants.

For source countries that are less than 25% Muslim, the respondents greatly underestimated the crime rate (by a factor of 1 or more) of people from Colombia, Ghana, Guyana, Suriname, Congo, Cape Verde, Angola, Dominican Republic, and the Netherlands Antilles. Conversely, the same respondents overestimated the crime rate of people from Canada, Israel, Argentina, Denmark, Bulgaria, Finland, China, Mexico, Japan, and Romania.

Do you see a pattern? The respondents were systematically underestimating the criminality of immigrants from sub-Saharan Africa and the Caribbean. The data seem to show a strong pro-Black bias, much stronger than the postulated pro-Muslim bias. In fact, the latter may be largely explained by the former, since Muslim immigrants are generally darker-skinned than the Dutch and often have visible African ancestry. "Pro-Muslim bias" was particularly strong toward immigrants from North Africa.

Frankly, given the messaging of contemporary Western culture, I am not surprised that a pervasive tendency exists to underestimate the crime rate of immigrants with black skin. I am surprised, however, that this pro-Black bias was accompanied by a bias against immigrants with white skin. The latter bias existed even against relatively light-skinned Chinese and Afghans. It was especially strong against Romanian immigrants, who are mostly Roma.(1)

The last point is sobering. Roma criminality was overestimated by the same Good People who underestimated Black criminality. The Roma apparently don't benefit from the pro-Black messaging of modern culture.


Note

1. Figures are hard to come by, since Roma in Western Europe identify themselves to the authorities by their country of origin, and not by their ethnicity. There is certainly a perception that the recent wave of Romanian migrants in Western Europe is largely of Roma origin.

In these figures, the number relating to the Roma is indeterminate since the ethnicity of asylum seekers is not recorded. Nonetheless, the assumption is that the majority of these applications were made by Roma. Certainly, the press is of this view. Articles discussing Czech or Romanian asylum seekers refer frequently to the Roma. As a result, it is easy for the ordinary member of the public to assume that such groups of applicants are of Roma extraction (Stevens 2003, p. 440)


References

Kirkegaard, E.O.W., and A. Gerritsen. (2021). A study of stereotype accuracy in the Netherlands: immigrant crime, occupational sex distribution, and provincial income inequality. OpenPsych under review. https://openpsych.net/forums/2/thread/238/

Myrdal, G. (1944). An American Dilemma. The Negro Problem and Modern Democracy. New York: Harper and Row.

Pauli, M. (2006). Harper Lee tops librarians' must-read list. The Guardian, March 2. https://www.theguardian.com/books/2006/mar/02/news.michellepauli

Stevens, D.E. (2003). The Migration of the Romanian Roma to the UK: A Contextual Study. European Journal of Migration and Law 5(4): 439-461. https://doi.org/10.1163/157181603322849343

Reviewer

This isn't really my area of expertise, so I'm of limited help in evaluating this manuscript. Nevertheless, I'll try my best. Here is my feedback:

  • Page 2 shifts suddenly from discussing stereotype accuracy to stereotype threat. These are two separate concepts, and it is not wise to shift from one to another and then back again in the same paragraph. If you must discuss both in your introduction, put them in separate paragraphs and smoothly transition from one topic to another.
  • Pages 7-8: When discussing the different levels of analysis, you should consider stating that stereotypes can lead to different behaviors at the different levels. At the individual, a person's beliefs about a group can lead to that individual making heuristic decisions that can be efficient (if based on stereotype accuracy and in the absence of individual data about a particular individual) or incorrect (if based on erroneous stereotypes). At the group level, average stereotypes about target groups could lead to political decision (like support or opposition to immigration) or organized opposition to societal integration. 
  • Page 11: For non-Dutch readers, please add a label or metric stating how far left- or right-wing the parties are and any special labels (e.g., communist, nationalist). Reading this manuscipt, I have no idea what the political leanings of this sample really are. A little bit of this information is found later in the manuscript (on pp. 15, 16, 20), but it would be most helpful in the table on p. 11.
  • Page 12: How many/what percentage of sample members assigned equal values for all groups? Based on the sample sizes in the table, it looks like 17 individuals, but I'm not sure. Please clarify.
  • Page 13: I don't understand the sentence that begins "This is due to a long term of people . . ." Do you mean "long tail"?
  • Pages 13, 25, 28, and 33: Because of floor and ceiling effects, I think you might have some heteroskedasticity in some of your scatterplots. Please check for this by calculating the correlation between the independent variable and the dependent variable's residuals for each correlation.
  • Page 15 (and other similar tables): I'm not sure "small model" is the terminology you want in the table. Maybe "parsimonious model" or "limited model" or "preliminary model"?
  • Page 22: "Tunisia" is spelled wrong in your figure and in the text.
  • Page 46: Revise ". . . no country has a below Dutch crime rate estimate . . ." to ". . . the lowest crime rate estimate was for the Dutch, but about 35% of countries actually have a crime rate below that of Netherlands natives."
Author | Admin
Replying to

Emil,

Is it pro-Muslim bias or pro-Black bias? On p. 49 "Scatterplot of Muslim% and the estimation error from the average stereotype," your graph actually shows a tendency to overestimate the criminality of immigrants from Indonesia, Syria, Turkey, and Pakistan — all of which are Muslim countries. The pro-Muslim bias exists only for immigrants from North Africa and Somalia, i.e., Muslims who, to varying degrees, are categorized as "Black" by native Dutch people.

The same pro-Black bias can be seen on the left-side of your graph. On the one hand, the Dutch respondents overestimate the criminality of immigrants from Mexico, Romania, Poland, Hungary, the Philippines, China, and Argentina. On the other hand, they underestimate the criminality of immigrants from Guyana, Suriname, Congo, Angola, Cape Verde, the Netherlands Antilles, and the Dominican Republic.

Do you see the pattern? I see a very strong pro-Black bias in your data. The pro-Muslim bias is less consistent and may simply be an artifact of that bias, i.e., most Muslim immigrants come from North Africa or Somalia. I also see an anti-Roma bias. The respondents overestimated the criminality of immigrants from Romania, Poland, and Bulgaria.

Would it be possible to have two versions of this graph by political tendency? In other words, one graph showing how nationalist voters estimate the criminality of immigrant groups and another graph showing how other voters estimate the criminality of immigrant groups.

Thank you for these. I have added results for both.

The appendix now contains the new nationalist results, shown here:

In the main text, we added your suggestion for African bias. You seem to be very much right!


Author | Admin
Replying to

This isn't really my area of expertise, so I'm of limited help in evaluating this manuscript. Nevertheless, I'll try my best. Here is my feedback:

  • Page 2 shifts suddenly from discussing stereotype accuracy to stereotype threat. These are two separate concepts, and it is not wise to shift from one to another and then back again in the same paragraph. If you must discuss both in your introduction, put them in separate paragraphs and smoothly transition from one topic to another.
  • Pages 7-8: When discussing the different levels of analysis, you should consider stating that stereotypes can lead to different behaviors at the different levels. At the individual, a person's beliefs about a group can lead to that individual making heuristic decisions that can be efficient (if based on stereotype accuracy and in the absence of individual data about a particular individual) or incorrect (if based on erroneous stereotypes). At the group level, average stereotypes about target groups could lead to political decision (like support or opposition to immigration) or organized opposition to societal integration. 
  • Page 11: For non-Dutch readers, please add a label or metric stating how far left- or right-wing the parties are and any special labels (e.g., communist, nationalist). Reading this manuscipt, I have no idea what the political leanings of this sample really are. A little bit of this information is found later in the manuscript (on pp. 15, 16, 20), but it would be most helpful in the table on p. 11.
  • Page 12: How many/what percentage of sample members assigned equal values for all groups? Based on the sample sizes in the table, it looks like 17 individuals, but I'm not sure. Please clarify.
  • Page 13: I don't understand the sentence that begins "This is due to a long term of people . . ." Do you mean "long tail"?
  • Pages 13, 25, 28, and 33: Because of floor and ceiling effects, I think you might have some heteroskedasticity in some of your scatterplots. Please check for this by calculating the correlation between the independent variable and the dependent variable's residuals for each correlation.
  • Page 15 (and other similar tables): I'm not sure "small model" is the terminology you want in the table. Maybe "parsimonious model" or "limited model" or "preliminary model"?
  • Page 22: "Tunisia" is spelled wrong in your figure and in the text.
  • Page 46: Revise ". . . no country has a below Dutch crime rate estimate . . ." to ". . . the lowest crime rate estimate was for the Dutch, but about 35% of countries actually have a crime rate below that of Netherlands natives."

Thanks for the suggestions. We have done:

  1. Rewrote the transition from stereotype threat to stereotype accuracy to make it smoother.
  2. We added a brief discussion of the levels of influence.
  3. We added the political ideology and position according to Wikipedia at https://en.wikipedia.org/wiki/List_of_political_parties_in_the_Netherlands
  4. 15 individuals, so 2.44%. On average, subjects assigned 27% of the cells a value of 1.
  5. Yes, we meant "long tail". This has been fixed. Good eye!
  6. The heteroscedasticity is obvious in many of the scatterplots. We are not sure what the purpose is of calculating effect sizes for these though.
  7. We have renamed the small models to "limited model".
  8. Good catch. We have renamed it in the data file, and updated the output and figures.
  9. We revised the sentence about below Dutch crime rate, as suggested.
Bot

Authors have updated the submission to version #2

Reviewer

The last figure should be titled something like "Deviation of perceived arrest rate from actual arrest rate versus % Black Africans in country of origin". You could use the term "Sub-Saharan Africans," although it's really skin color that explains why the respondents are under-estimating the arrest rate.

I was surprised to see that Morocco has zero Sub-Saharan Africans. I've known many foreign students from that country, and a large number were visibly of SSA ancestry (and self-identified as such). Genetic studies put the level of SSA admixture in Morocco at around 20%.

I'm not sure I understand the graph of nationalist vs. non-nationalist estimates of arrest rates. Does it show that even nationalist voters tend to under-estimate the arrest rate of Muslim/African immigrants and over-estimate the arrest rate of European immigrants?


Author | Admin
Replying to Wed 10 Mar 2021 20:46

The last figure should be titled something like "Deviation of perceived arrest rate from actual arrest rate versus % Black Africans in country of origin". You could use the term "Sub-Saharan Africans," although it's really skin color that explains why the respondents are under-estimating the arrest rate.

I was surprised to see that Morocco has zero Sub-Saharan Africans. I've known many foreign students from that country, and a large number were visibly of SSA ancestry (and self-identified as such). Genetic studies put the level of SSA admixture in Morocco at around 20%.

I'm not sure I understand the graph of nationalist vs. non-nationalist estimates of arrest rates. Does it show that even nationalist voters tend to under-estimate the arrest rate of Muslim/African immigrants and over-estimate the arrest rate of European immigrants?


Changed captions to:

  • Figure X. Scatterplot showing deviation of perceived arrest rate from actual arrest rate versus % Muslim in country of origin.
  • Figure X. Scatterplot showing deviation of perceived arrest rate from actual arrest rate versus % Sub-Saharan African in country of origin.

We used the Putterman migrant matrix (https://sites.google.com/brown.edu/louis-putterman/world-migration-matrix-1500-2000). It does not track genetic ancestry per se and is not based on genetic testing, but based on known movements of people after 1500. So any prior movement before that, or movements not recorded in their estimates, are not taken into account.

Both nationalist voters overestimated the average relative crime rate (mean errors is large and positive) and non-nationalists did not (mean error near zero). The nationlists got the dispersion correct (SD error near zero), but non-nationalists underestimated real differneces by a large amount (SD error -0.55). The scatterplot does not show their accuracies or biases, just the relationship between the two sets of estimates. Since you ask, I computed the Muslim and African bias plots by group as well. We see that the nationalists have a bias against Muslims, and in favor of Africans. The non-nationalists have biases in favor of both groups.

Bot

Authors have updated the submission to version #3

Author | Admin

I was sort of wrong about the Putterman Weil matrix. Here's their methods:

A crucial and challenging piece of our methodology is the attribution, with proper weights, of mixed populations such as mestizos and mulattoes to their original source countries. Saying, for example, that Mexican mestizos are descended from Spanish immigrants and native Mexicans gives no information about the shares of these different groups in their ancestry. Socially constructed descriptions of race and ethnicity may differ from the mathematical contributions to individuals’ ancestry in which we are interested. Contributions from particular groups may be suppressed, exaggerated, or simply forgotten.

For these reasons, whenever possible we have used genetice vidence as the basis for dividing the ancestry of modern mixed groups that account for large fractions of their country’s population.5 The starting point for this analysis is differences in the frequencies with which different alleles (alternative DNA sequences at a fixed position on a chromosome) appear in ancestor populations from different parts of the world. Comparing the allele frequency in a modern population with the frequency in source populations, one can derive an estimate of the percentage contribution for each source. Early studies in this literature used blood group frequencies in modern populations to estimate ancestry. More recent studies use allele frequencies for multiple genes. In selecting among studies, we favored those based on larger samples with well-identified source populations as well as those done in more recent years using modern techniques.6 The genetic studies we consulted were sometimes of specific groups (such as mestizos) and sometimes of the population as a whole, unconditional on race or ethnicity. In the former case, we applied the genetic evidence to divide up ancestry in the particular mixed group, and multiplied by that group’s representation in the overall population.7

So I don't know about your Morocco example. Perhaps they simply made a mistake, or results were not known at the time. If we look at Morocco in the migration matrix, we find they estimate it to originate 90% from the population living in that country in year 1500, and 8% from Spain. The remaining are small numbers from related countries, e.g. 0.6% from Mauritania (left coast North African, also with SSA admixture).

Reviewer

SSA ancestry in Moroccans is around 20%, although it varies a lot within the country.

The methodology will depend on the hypothesis you wish to test. Your results suggest that people in the Netherlands (and probably throughout the West) are being conditioned to view the Black African phenotype positively and the White European phenotype negatively.

This anti-White bias is causing your Dutch respondents to over-estimate the arrest rate not only of European immigrants but also of any group that deviates too far from the Black African phenotype, including Chinese and Roma. Interestingly, the same bias is causing a differentiation in Dutch perception of different Muslim groups, apparently according to their degree of "Blackness": North Africans are perceived as being better than they really are, while Turks are perceived as being worse than they really are. 

This pro-Black bias is apparent even among Nationalist voters, who over-estimate the arrest rate of Muslim immigrants while under-estimating the arrest rate of Black African immigrants. We are truly living in interesting times!

Author | Admin

It's certainly interesting. Well, I know what to study in the next paper on this general topic. We need to collect some more stereotypes about crime data in more countries, and see if this pattern holds in pre-registered study in another country. We have crime rates for immigrants in UK, Denmark, Norway, Finland, Germany, so one could do surveys in these countries to measure the criminality stereotypes and replicate this analysis.

Remember the tick the "Approve" button when you sare satisfied with the submission, which it seems you are.

Reviewer

Again, keep in mind that this isn't my area of expertise, so I am not as helpful as Reviewer #1. (I recommend getting at least one more reviewer to compensate for my weaknesses.) Within the limitations of my abilities and knowledge, here is the best feedback I can give:

  • I believe that a heteroskedasticity check would be useful in helping you identify the severeity of the violations of the assumptions of regression. This may indicate that it would be helpful to transform some variables to improve model fit. Another possibility is that sever heteroskedacity could suggest some alternative analyses (relegated to an appendix) where outliers are eliminated. This would be a useful robustness check on your results.
  • Page 3: Change "science does not know" to "it is not clear". Don't anthropomorphize anything. "Science" cannot know anything because it is not conscious. A similar language error is on p. 20: "BMA does not think education is as important . . ." should be changed to "BMA does not find intelligence to be as important . . ."
  • On page 4, what are the "units" in the list of survey components? Are these test items?
Author | Admin
Replying to Reviewer 2

Again, keep in mind that this isn't my area of expertise, so I am not as helpful as Reviewer #1. (I recommend getting at least one more reviewer to compensate for my weaknesses.) Within the limitations of my abilities and knowledge, here is the best feedback I can give:

  • I believe that a heteroskedasticity check would be useful in helping you identify the severeity of the violations of the assumptions of regression. This may indicate that it would be helpful to transform some variables to improve model fit. Another possibility is that sever heteroskedacity could suggest some alternative analyses (relegated to an appendix) where outliers are eliminated. This would be a useful robustness check on your results.
  • Page 3: Change "science does not know" to "it is not clear". Don't anthropomorphize anything. "Science" cannot know anything because it is not conscious. A similar language error is on p. 20: "BMA does not think education is as important . . ." should be changed to "BMA does not find intelligence to be as important . . ."

I made the language changes as requested.

I am not sure what to make of this heteroscedasticity (HS) request. It is obvious from the plots there is HS. Any test of HS will produce a tiny p value, so NHST is a moot. As example, the results in Figure "Figure X. Scatterplots of intelligence and the metrics of stereotype accuracy. Abs = absolute, sd = standard deviation.", I applied the same method as in this paper (https://www.researchgate.net/publication/350394153_Are_there_Complex_Assortative_Mating_Patterns_for_Humans_Analysis_of_340_Spanish_Couples; code is also here https://rpubs.com/EmilOWK/heteroscedasticity). Formal testing for mean_abs_error variable:

> MAD_model = ols(mean_abs_error ~ g, data = d_HS)
> MAD_model
Linear Regression Model
 
 ols(formula = mean_abs_error ~ g, data = bind_cols(stereo_immi_accu,
     d["g"]))
 
                 Model Likelihood    Discrimination    
                       Ratio Test           Indexes    
 Obs     615    LR chi2     57.85    R2       0.090    
 sigma0.8597    d.f.            1    R2 adj   0.088    
 d.f.    613    Pr(> chi2) 0.0000    g        0.305    
 
 Residuals
 
     Min      1Q  Median      3Q     Max
 -1.0720 -0.4805 -0.2448  0.1050  5.0529
 
 
           Coef    S.E.   t     Pr(>|t|)
 Intercept  1.2336 0.0347 35.59 <0.0001
 g         -0.2698 0.0347 -7.78 <0.0001
 
> test_HS(resid = resid(MAD_model), x = d$g)
# A tibble: 4 x 5
  test         r2adj        p fit          log10_p
  <chr>        <dbl>    <dbl> <named list>   <dbl>
1 linear raw  0.100  4.44e-16 <ols>         15.4  
2 spline raw  0.0991 5.35e- 1 <ols>          0.271
3 linear rank 0.254  0.       <ols>        Inf    
4 spline rank 0.263  1.27e- 2 <ols>          1.90

Tests for linear HS find p's of 4.44e-16 and 0 (i.e. below R's precision level). We can plot the residuals and see for ourselves:

#plot
#first add quantiles
d_HS$mean_abs_error_10 = quantile_smooth(x = d_HS$g,
                                              y = d_HS$mean_abs_error,
                                              quantile = .10,
                                              method = "qgam")
d_HS$mean_abs_error_90 = quantile_smooth(x = d_HS$g,
                                              y = d_HS$mean_abs_error,
                                              quantile = .90,
                                              method = "qgam")
d_HS %>%
  ggplot(aes(g, mean_abs_error)) +
  geom_point(alpha = .2) +
  geom_smooth(method = lm, se = F) +
  geom_ribbon(mapping = aes(
    ymin = mean_abs_error_90,
    ymax = mean_abs_error_10
  ), alpha = .4)

HS and effect sizes

HS violates the assumption of OLS, but does not affect slopes or correlations. It only affects the standard errors, especially those of precision (which need to be larger in the larger error area, and smaller in smaller error area). For the purposes of this study, then, I don't see a lot of reason to try any transformations. A simple approach is using Spearman rank correlations, which do not have any such assumption, and these produce similar results:

kirkegaard::combine_upperlower(
  .upper.tri = d_HS %>% cor(method = "pearson", use = "pairwise"),
  .lower.tri = d_HS %>% cor(method = "spearman", use = "pairwise")
)
               pearson_r  rank_r mean_abs_error      sd sd_error sd_error_abs    mean mean_error mean_error_abs       g
pearson_r             NA  0.9151         -0.179  0.1885   0.1885       0.0681 -0.0266    -0.0266         -0.169  0.2049
rank_r             0.902      NA         -0.205  0.1866   0.1866       0.0483 -0.0369    -0.0369         -0.201  0.2315
mean_abs_error    -0.302 -0.3348             NA  0.6107   0.6107       0.3858  0.8891     0.8891          0.963 -0.2996
sd                 0.205  0.2140          0.592      NA   1.0000       0.4856  0.6715     0.6715          0.455 -0.2337
sd_error           0.205  0.2139          0.592  1.0000       NA       0.4856  0.6715     0.6715          0.455 -0.2337
sd_error_abs      -0.018 -0.0523          0.272 -0.0755  -0.0755           NA  0.3222     0.3222          0.362 -0.0651
mean               0.139  0.1584          0.345  0.7492   0.7492       0.0152      NA     1.0000          0.828 -0.2362
mean_error         0.139  0.1584          0.345  0.7492   0.7492       0.0152  1.0000         NA          0.828 -0.2362
mean_error_abs    -0.177 -0.2233          0.704  0.1651   0.1651       0.4623  0.0123     0.0123             NA -0.2420
g                  0.186  0.2117         -0.322 -0.2429  -0.2429      -0.0165 -0.1957    -0.1957         -0.154      NA

E.g., relationship between g and mean_abs_error shows obvious HS, but the difference in correlations is -.2996 (Pearson) vs. -0.322 (Spearman).

Units of questionnaire

On page 4, what are the "units" in the list of survey components? Are these test items?

Yes, these are questions, but since these are presented together, they are not stand-alone questions. For instance, the question about crime rate looks like this in the survey. I believe a guest can see the live test version here https://survey.alchemer.eu/collab/90215247/Nederland-Survey-2020:

I added a footnote to clarify this in case anyone else has the same question.

Bot

Authors have updated the submission to version #4

Reviewer

I read Emil's paper, and find this is a fine study, very detailed. Emil really knows how to extract the maximal amount of information from the data. So, I can only say I approve it, without being able to make anything in the way of constructive suggestions for improvements. But of course Emil made quite a few improvements already based on the other reviewers' input, so I guess it is pretty much ready to be accepted if the other reviewers are also happy.

Bot

Authors have updated the submission to version #6