Rpubs should work, of course, except here, no one can replicate your results, because you don't display the packages and some objects are missing, even right right as the start, just as before (the missing objects I pointed out a long time ago were never fixed). This may have consequences. For instance, when i try to run your code,
describe2(stop %>% select(n, wn, Test.Quality, Female.ratio, Mean.age))
I get N 2065, yet it's N 2086 in your rpubs.
Yet I accepted the publication, but I will offer two solutions, before the submission is sent to typesetters. 1) a public note will be added to the submission about the code not running properly and getting slightly different results. 2) the public note will be removed if the Rpubs is fixed and code runs properly without any error, from beginning to end.
Meanwhile, I want you to examine these inconsistencies, because there are definitely errors in the reports. These must be fixed!
From your rpubs:
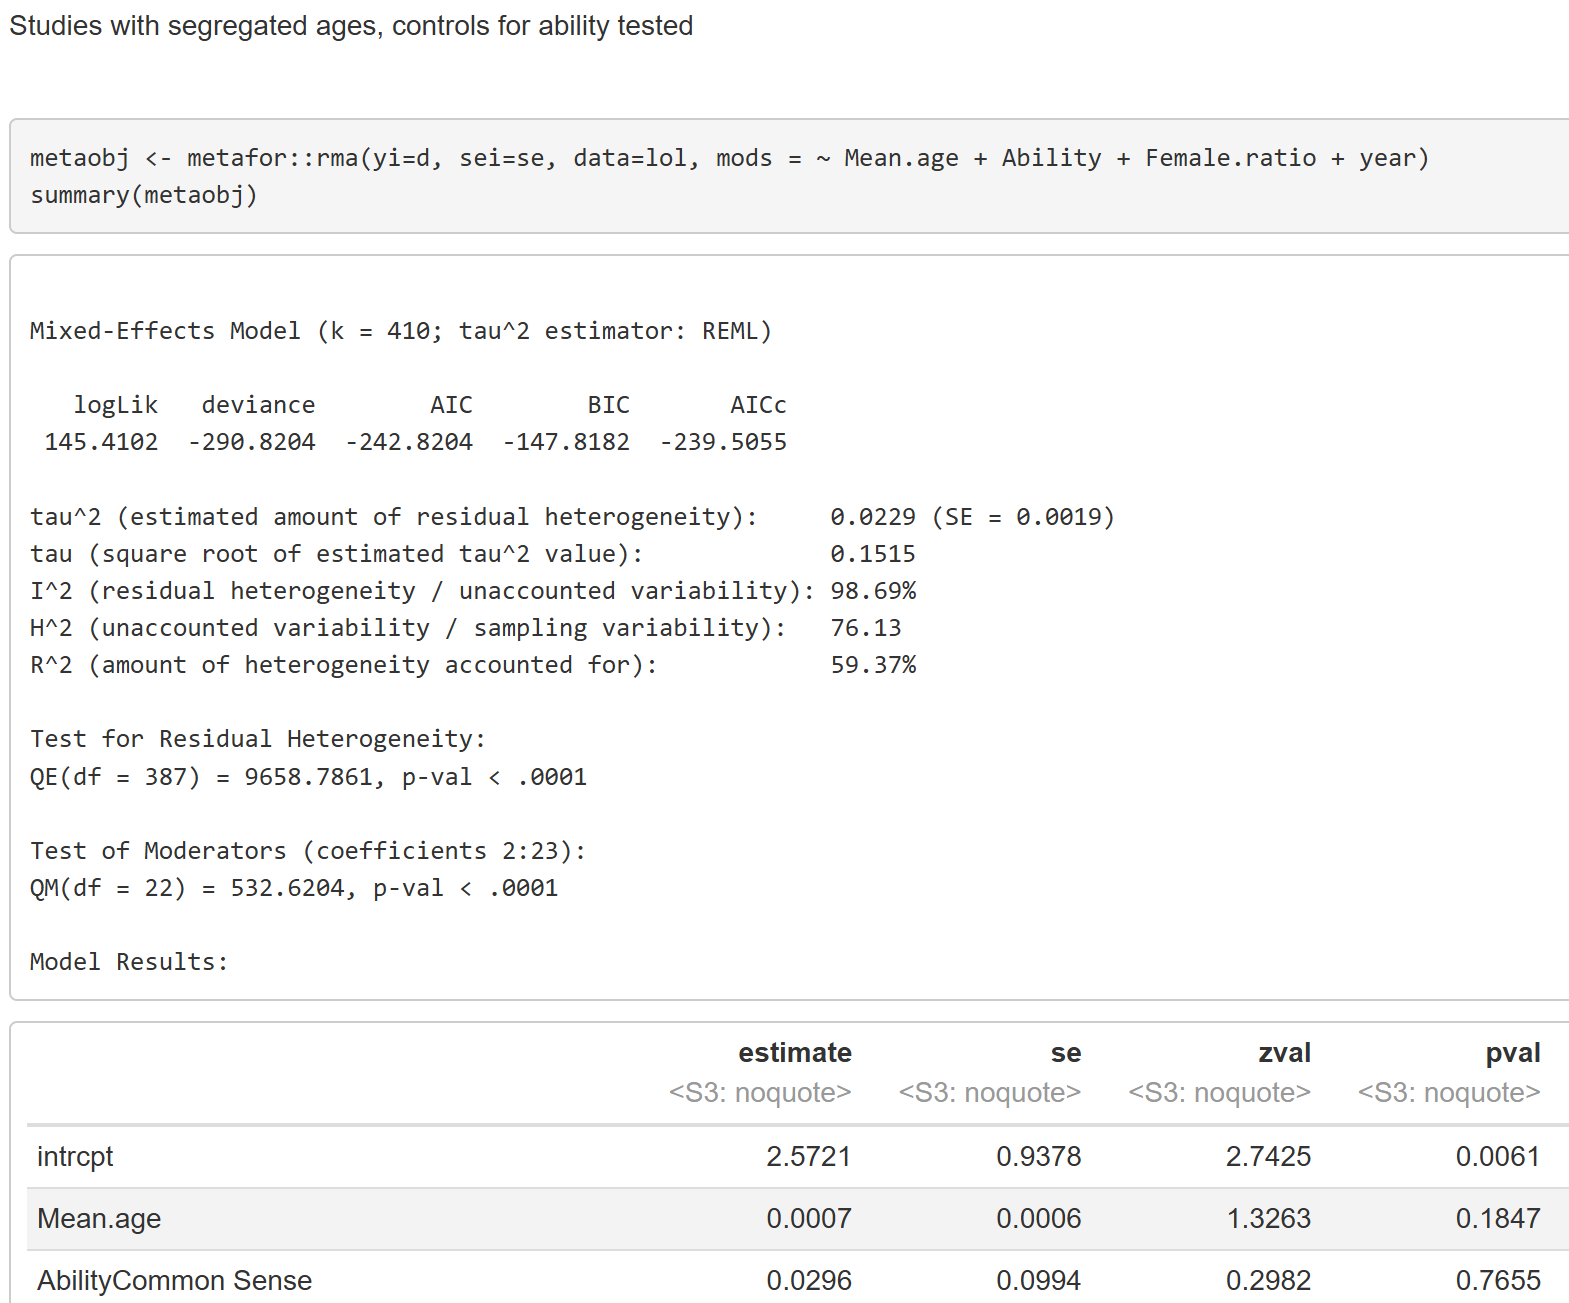
Studies with segregated ages likely means effects for different ages within studies. But in Table A2 you report
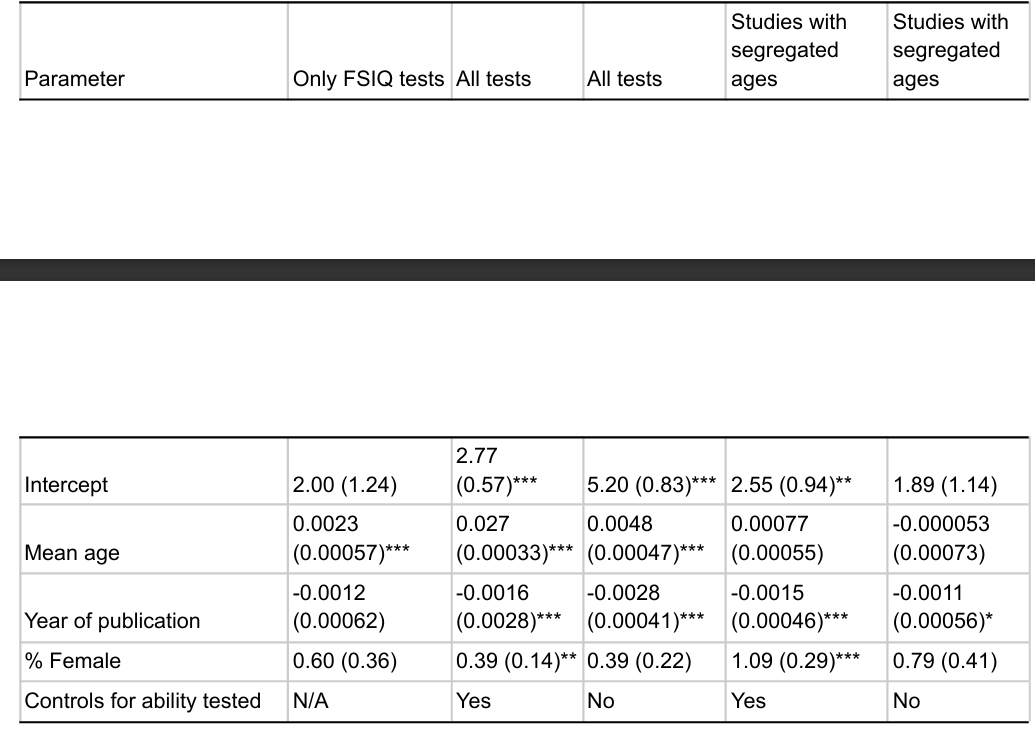
Yet in the rpubs it's 1.809 (0.30), but not 1.09 (0.29). Moreover, in the result section you wrote "Studies that explicitly tested the developmental theory by comparing sex differences within age groups also had an age effect, though it did not pass significance testing (b = .00077, p = .16)." If the number 0.00077 refers to this analysis, then the p value is wrong. As per the rpubs, it should be p = 0.1847.

These numbers too don't match what you reported in the last column of table A2. The SE is 0.0008 nor 0.00073. Female ratio is also different in your submitted paper.
Other columns in table A2, all have the same problems, with numbers differing slightly. Take this for instance:
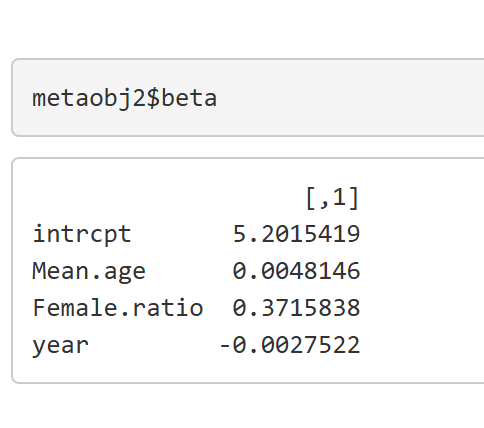
It should correspond to the third column of Table A2. Yet in the paper you reported female ratio of 0.39 instead of 0.37.
A quibble, in the result as well, you reported "Adult men scored slightly higher in full scale ability (d = .17, p < .001) when all of the adult samples were pooled together. This difference remained within a sample that included only the highest quality samples (d = .17, 95% CI [.13, .22], I^2 = 98.2%, p < .00001)." yet in the abstract it reads "Men scored 2.57 IQ points (95% CI [1.91, 3.23], I^2 = 98.2%, k = 47) above women". I would recommend reporting the effect using the same metric, because it may be confusing.
Also, i looked at the rpubs, and I could not find the results related to Table A1 "Regression model based on the Project Talent data". It's not easy to read because there are many analyses in the rpubs not reported in the paper.
Finally, regardless of whether the rpubs is changed, you need to add the Rpubs link in your submission. No one would ever look at the thread to find your Rpubs.
