Replying to Reviewer 1
I like the paper. It provides an important replication regarding the Kruger-Dunning effect. However, I have two major concerns. These concerns have to do more with Gignac & Zajenkowski (2020) original method than with the implementation of this method in the current paper. Gignac & Zajenkowski (2020) offered that the existence of Kruger-Dunning effect should lead to (1) heteroscedasticity in which the variance of the residuals is higher when ability is low than when it is high and (2) convexity of the function relating estimated ability to actual ability. However, the problem with these effects is that they may be the result of a ceiling effect likely to stem from the “better than average” effect that clearly exist in ability evaluations.
These issues could be resolved by a simulation that introduce a ceiling effect into the ability estimates. I should also note here that of the two effects, the second is a bit more complex. The reason is that a Kruger-Dunning effect coupled with a better than average effect should lead not only to convexity in low ability (as Gignac & Zajenkowski argue), but also to concavity in high ability. These two effects are not easy to model (and perhaps may lead to linearity if the simultaneous existence of the two effects is not acknowledged). In this regard, I am not sure if the right model to use is LOESS. Perhaps a more appropriate model is TOBIT.
In sum, I am neither sure that the heteroscedasticity in high levels observed by he authors necessarily implies the existence of a Kruger-Dunning effect, nor that the linearity they observe necessarily implies a lack of a Kruger-Dunning effect. They both may be due to a ceiling effect resulting from a better than average effect.
If I am right, these issues may be resolved in a simulation, although such a simulation may be more appropriate to be published in Intelligence as a response to Gignac & Zajenkowski (2020).
Minor concerns
The paper is written very carelessly. If you want your work to have an influence you need to do a much better work in the writing. The casual way by which the paper is written leaves a bad impression. Here are some examples.
All Figures are labeled Figure X. It seems that you forgot to go over the paper and insert figure numbers.
In the abstract you write “(Gignac & Zajenkowski, 2020) suggested two ways to operationalize and test the theory. We carried out a replication of their study using archival data from a larger dataset” – but what are these two ways. They should be mentioned here and not in the next sentence
“A large meta-analysis found a mean observed r = .33 (Freund & Kasten, 2012)” – redundant we already saw it in Fig 1. Confusing – the reader thinks for a moment that this sentence represent a new information that was not communicated before, whereas it does not
“We scored the cognitive data” – what are “cognitive data” – you didn’t defined before “the model of interest” – I don’t understand this. Do you mean the parameter of interest is fit?
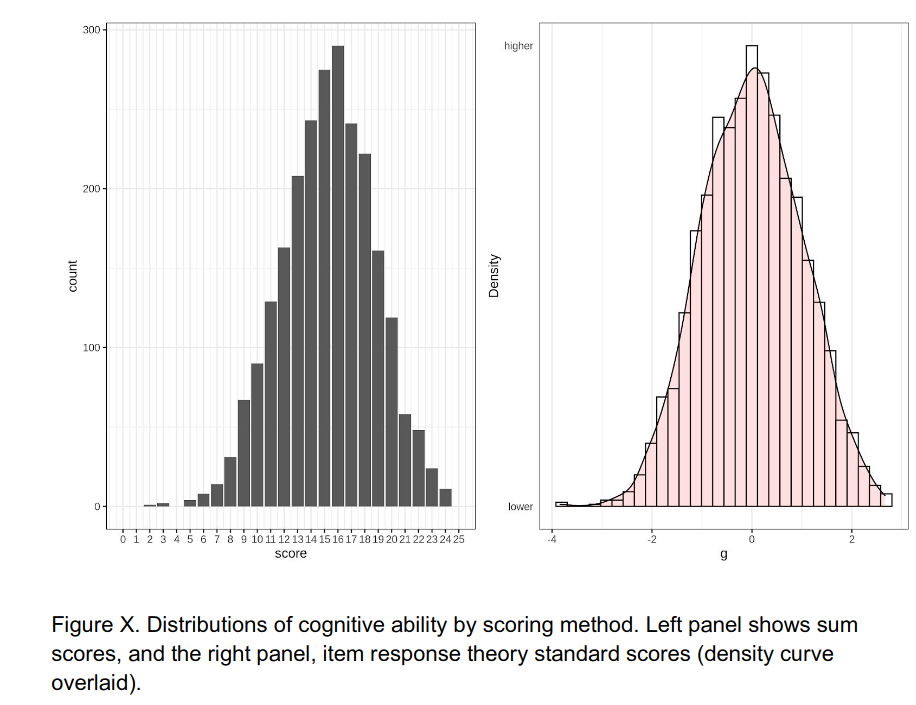
“Figure X. Distributions of cognitive ability” – Are we talking about cognitive ability or about scores in science test. If the authors think they are the same, they should clearly state that. Otherwise the reader is confused
You need to specify the figure caption from Dunning-Kruger original paper, otherwise the meaning of the figure is not clear. Reviewers should not go to the original paper to understand the figure?
You say that your purpose is to replicate Gignac & Zajenkowski’s findings, but you never specify what are their findings!!
Thanks for the helpful review.
Ceiling issues
Our data do not suffer much from ceiling problems, so I am not sure what to make of this comment. Distribution of objective scores from the submission:
The maximum score is 25, and no person attained this. Distribution of self-rated ability:
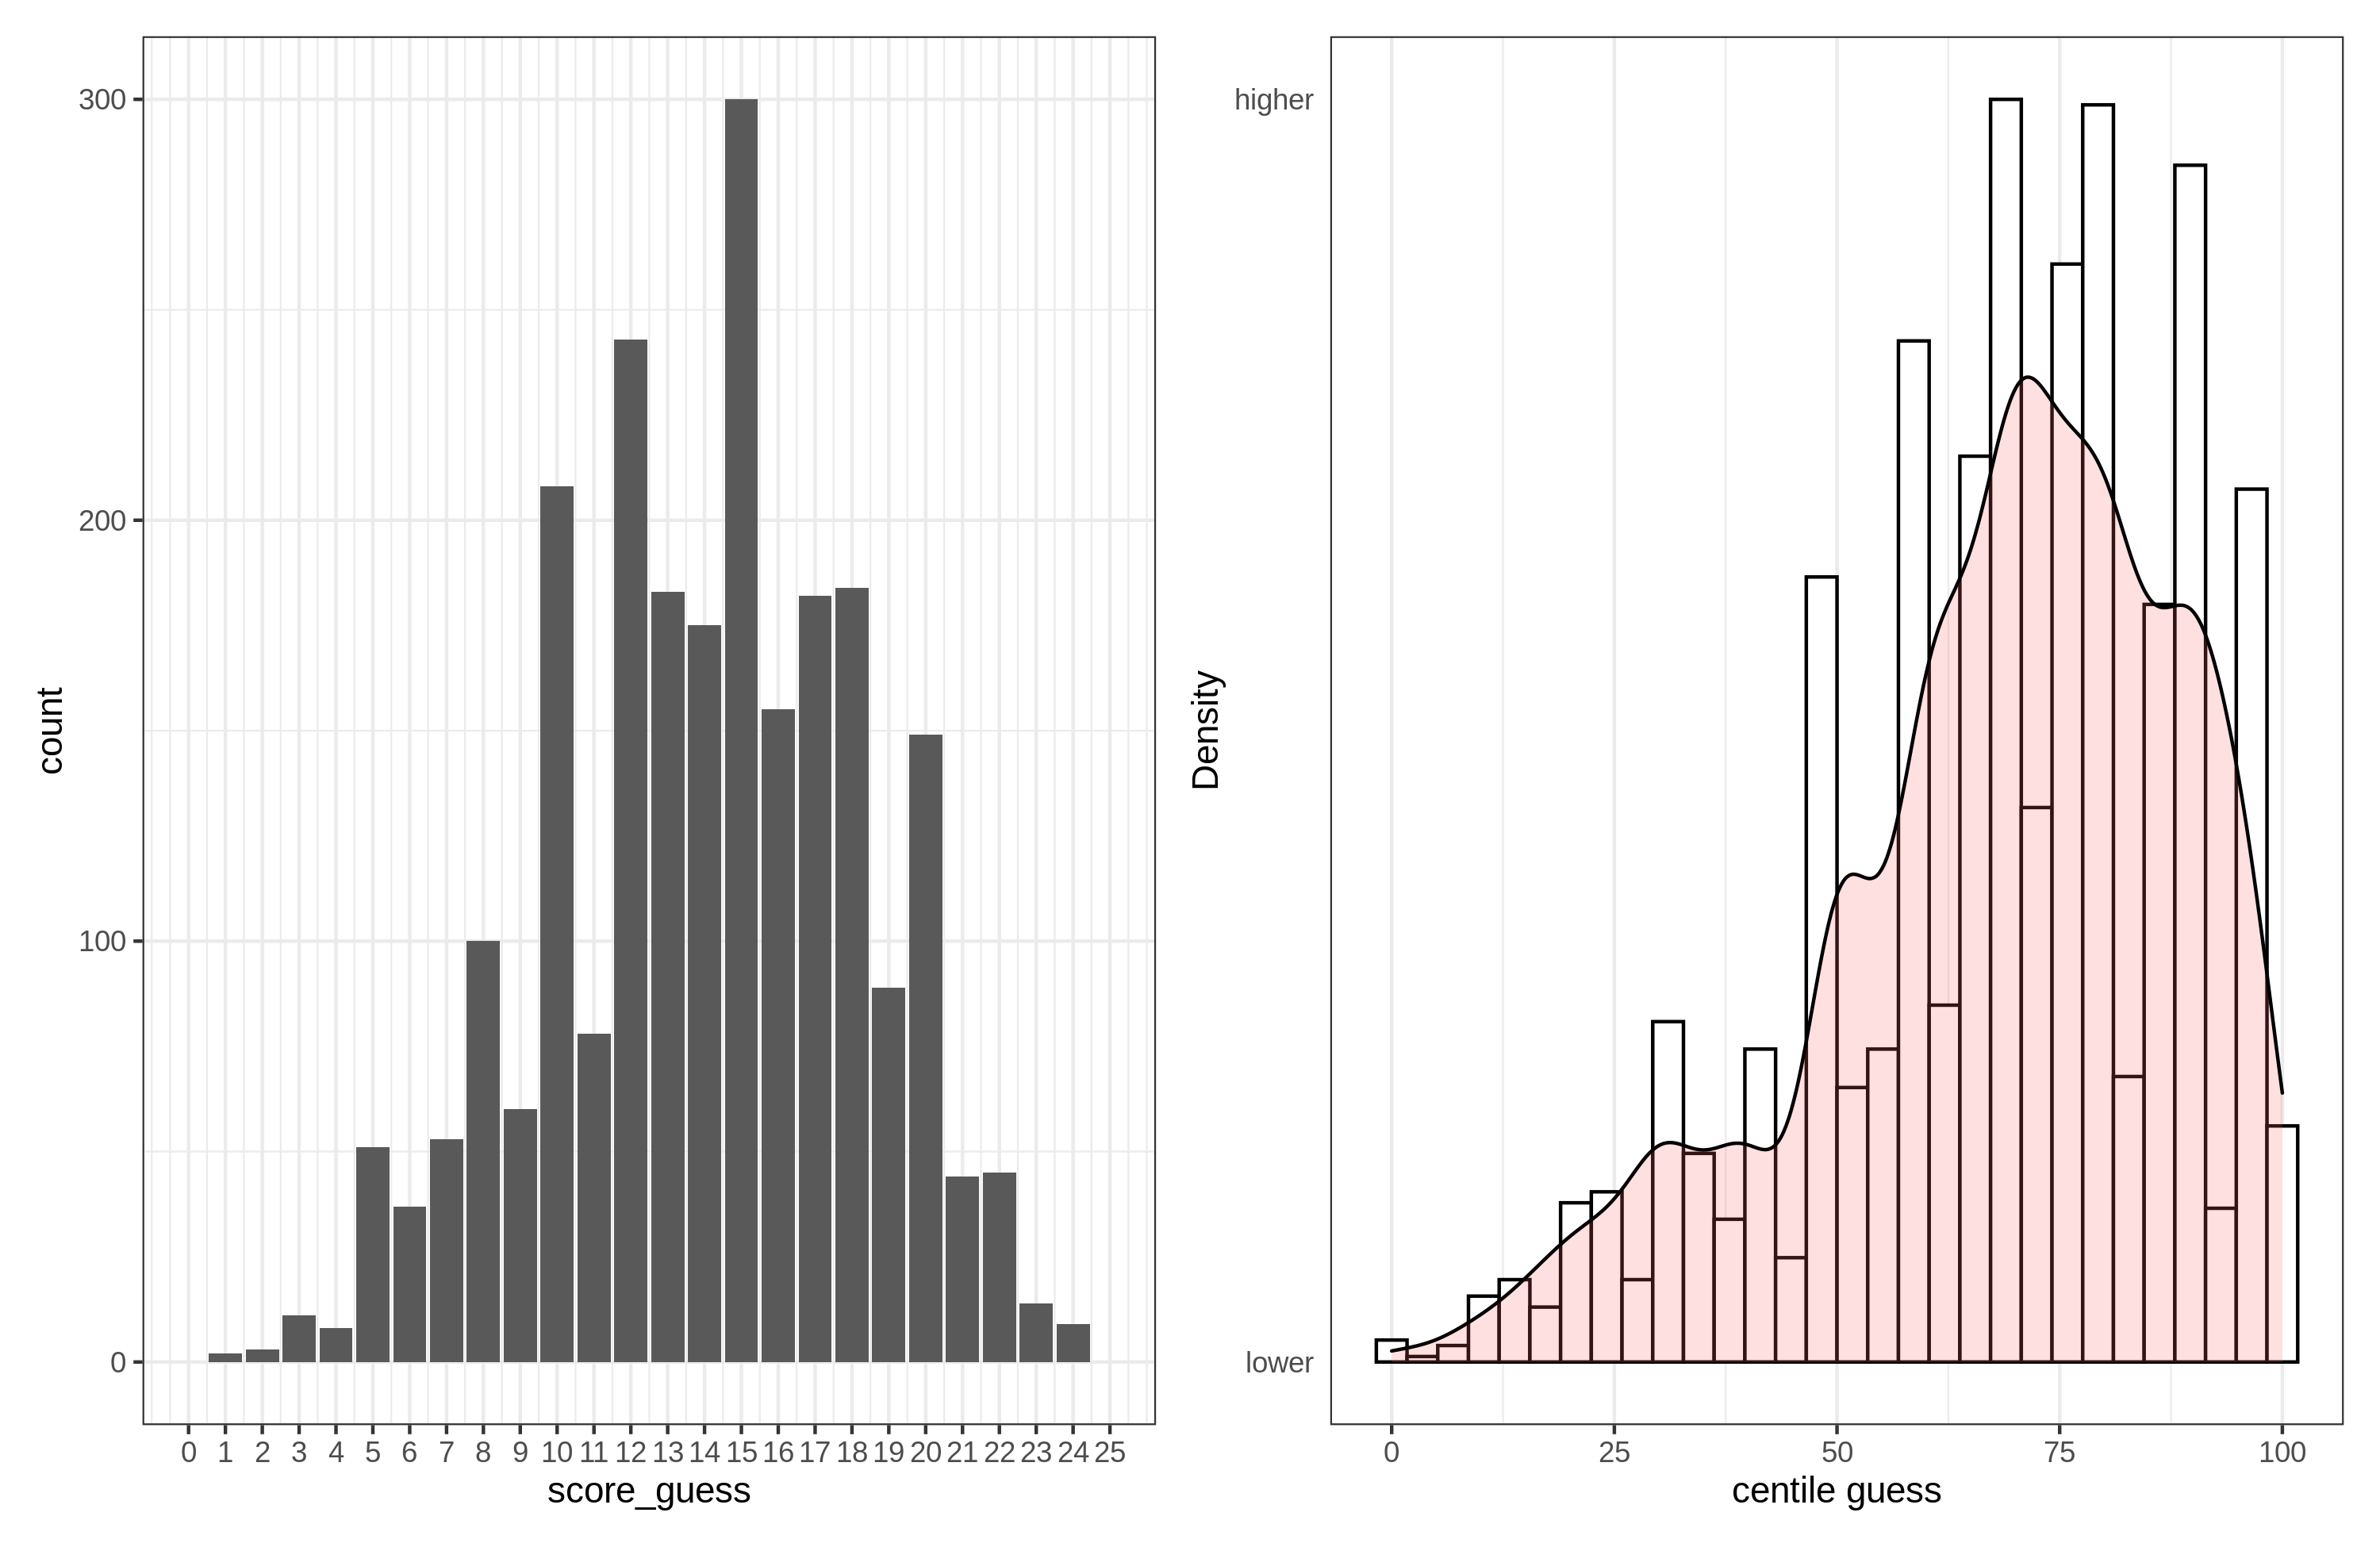
Only the centile guesses show some ceiling issues. But even here, not much to write about:
> #in %

> (quiz25_noOutlier$score == 25) %>% describe()

   vars    n mean sd median trimmed mad min max range skew kurtosis se

X1    1 2392    0  0      0       0   0   0   0     0  NaN      NaN  0

> (quiz25_noOutlier$score_guess == 25) %>% describe()

   vars    n    mean     sd median trimmed mad min max range skew kurtosis       se

X1    1 2388 0.00168 0.0409      0       0   0   0   1     1 24.4      592 0.000837

> (quiz25_noOutlier$g == max(quiz25_noOutlier$g, na.rm = T)) %>% describe()

   vars    n     mean     sd median trimmed mad min max range skew kurtosis       se

X1    1 2392 0.000418 0.0204      0       0   0   0   1     1 48.8     2385 0.000418

> (quiz25_noOutlier$centile_guess == 100) %>% describe()

   vars    n    mean     sd median trimmed mad min max range skew kurtosis      se

X1    1 2386 0.00712 0.0841      0       0   0   0   1     1 11.7      135 0.00172
Thus, for the worst case variable, 0.71% rated themselves as being in the 100th centile, and 0.17% guessed their own score was 25/25. It is true that the centile variable is skewed towards the upper ceiling:
> quiz25_noOutlier %>%

+   select(score, g, score_guess, centile_guess) %>%

+   describe()

              vars    n    mean    sd   median  trimmed   mad   min    max  range    skew kurtosis     se

score            1 2392 15.3198  3.36 15.00000 15.34065  2.97  5.00  24.00  19.00 -0.0626   -0.333 0.0688

g                2 2392  0.0101  0.97  0.00671  0.00547  1.03 -2.48   2.48   4.96  0.0456   -0.503 0.0198

score_guess      3 2388 14.0507  4.25 14.00000 14.15481  4.45  0.00  25.00  25.00 -0.2087   -0.313 0.0870

centile_guess    4 2386 68.2481 20.20 70.00000 70.08901 19.27  0.00 100.00 100.00 -0.7645    0.172 0.4135
But it is not much. Skew is -0.76.
Gignac and Zajenkowski's paper
R1 is right. We forgot to explain what this study did. We have now added this to the introduction:
(Gignac & Zajenkowski, 2020) applied these two methods to a dataset of 929 subjects who had taken the Raven’s advanced progressive matrices test (a standard nonverbal test) as well as rated themselves on a 1-25 scale. First, they found no evidence of heteroscedasticity using the Glejser test. This test involves saving the residuals from the linear model (self-estimated ability ~ objectively measured ability, where ~ denotes “regressed on”), converting to absolute values, and correlating with the predictor (i.e., objectively measured ability). The correlation was -.05 with 95% confidence interval of -.11 to .02. Second, they looked for a nonlinear association using a model comparison with a quadratic model. The model comparison found no incremental validity of the nonlinear model (incremental R2 < 1%). They plotted the data using a smoothing function (local regression, LOESS), which also showed no notable deviation from linearity. The purpose of this paper was to replicate the findings of (Gignac & Zajenkowski, 2020) in a new and larger sample using more robust methods for testing for heteroscedasticity and nonlinearity.
Writing
All Figures are labeled Figure X. It seems that you forgot to go over the paper and insert figure numbers.
These change as the manucript changes, and will be added in the typesetting step at the end.
In the abstract you write “(Gignac & Zajenkowski, 2020) suggested two ways to operationalize and test the theory. We carried out a replication of their study using archival data from a larger dataset” – but what are these two ways. They should be mentioned here and not in the next sentence
Their methods and results are not given in the introduction.
“A large meta-analysis found a mean observed r = .33 (Freund & Kasten, 2012)” – redundant we already saw it in Fig 1. Confusing – the reader thinks for a moment that this sentence represent a new information that was not communicated before, whereas it does not
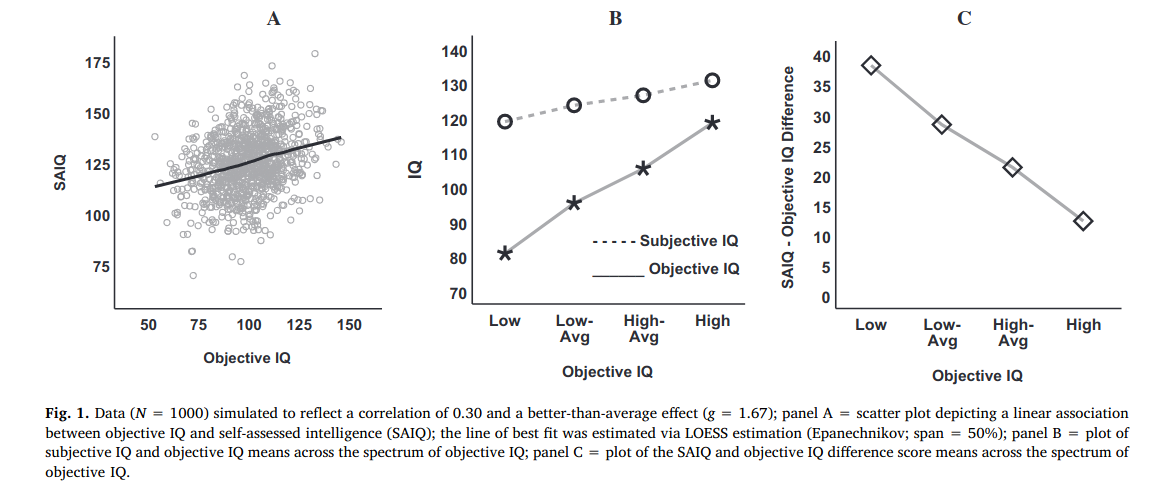
Figure 1 (Typical Dunning-Kruger pattern. Reproduced from (Kruger & Dunning, 1999)) is not related to Fruend and Kasten's meta-analysis, so I am not sure what to make of this comment. The point of including the effect sizes is to give the reader an idea of how strong the correlation typically is between these constructs. As it is, our paper finds substantially stronger correlations than this meta-analysis.
“We scored the cognitive data” – what are “cognitive data” – you didn’t defined before “the model of interest” – I don’t understand this. Do you mean the parameter of interest is fit?
Cognitive data are the data from the objective test. This is a fairly common term (18.5k hits on google scholar), so I don't know this is objected to. We changed the phrase to "cognitive ability data", maybe this will be enough clarification.
The model of interest refers to whatever model the research is looking for heteroscedasticity in. I changed the text to be a more clear:
Turning to the question of heteroscedasticity, we employed the same method as in (Kirkegaard, 2021). The approach is as follows: first, the model of interest is fit. This is the statistical model that wants to evaluate for heteroscedasticity. Second, the residuals are saved, standardized, and then converted to positive (absolute) values. Third, linear and nonlinear models are then fit to the residuals using the predictor of interest to look for evidence of heteroscedasticity.
“Figure X. Distributions of cognitive ability” – Are we talking about cognitive ability or about scores in science test. If the authors think they are the same, they should clearly state that. Otherwise the reader is confused
We changed the caption to:
Figure X. Distributions of scientific knowledge by scoring method. Left panel shows sum scores, and the right panel, item response theory standard scores (density curve overlaid).
You need to specify the figure caption from Dunning-Kruger original paper, otherwise the meaning of the figure is not clear. Reviewers should not go to the original paper to understand the figure?
I don't know what you mean. The caption already says this:
Figure X. Typical Dunning-Kruger pattern. Reproduced from (Kruger & Dunning, 1999).