Back to Submissions

1
Mixed evidence for Lynn's developmental theory of sex differences using aptitude tests

Submission status
Reviewing

Submission Editor
Emil O. W. Kirkegaard

Author
Meng Hu

Title
Mixed evidence for Lynn's developmental theory of sex differences using aptitude tests

Abstract

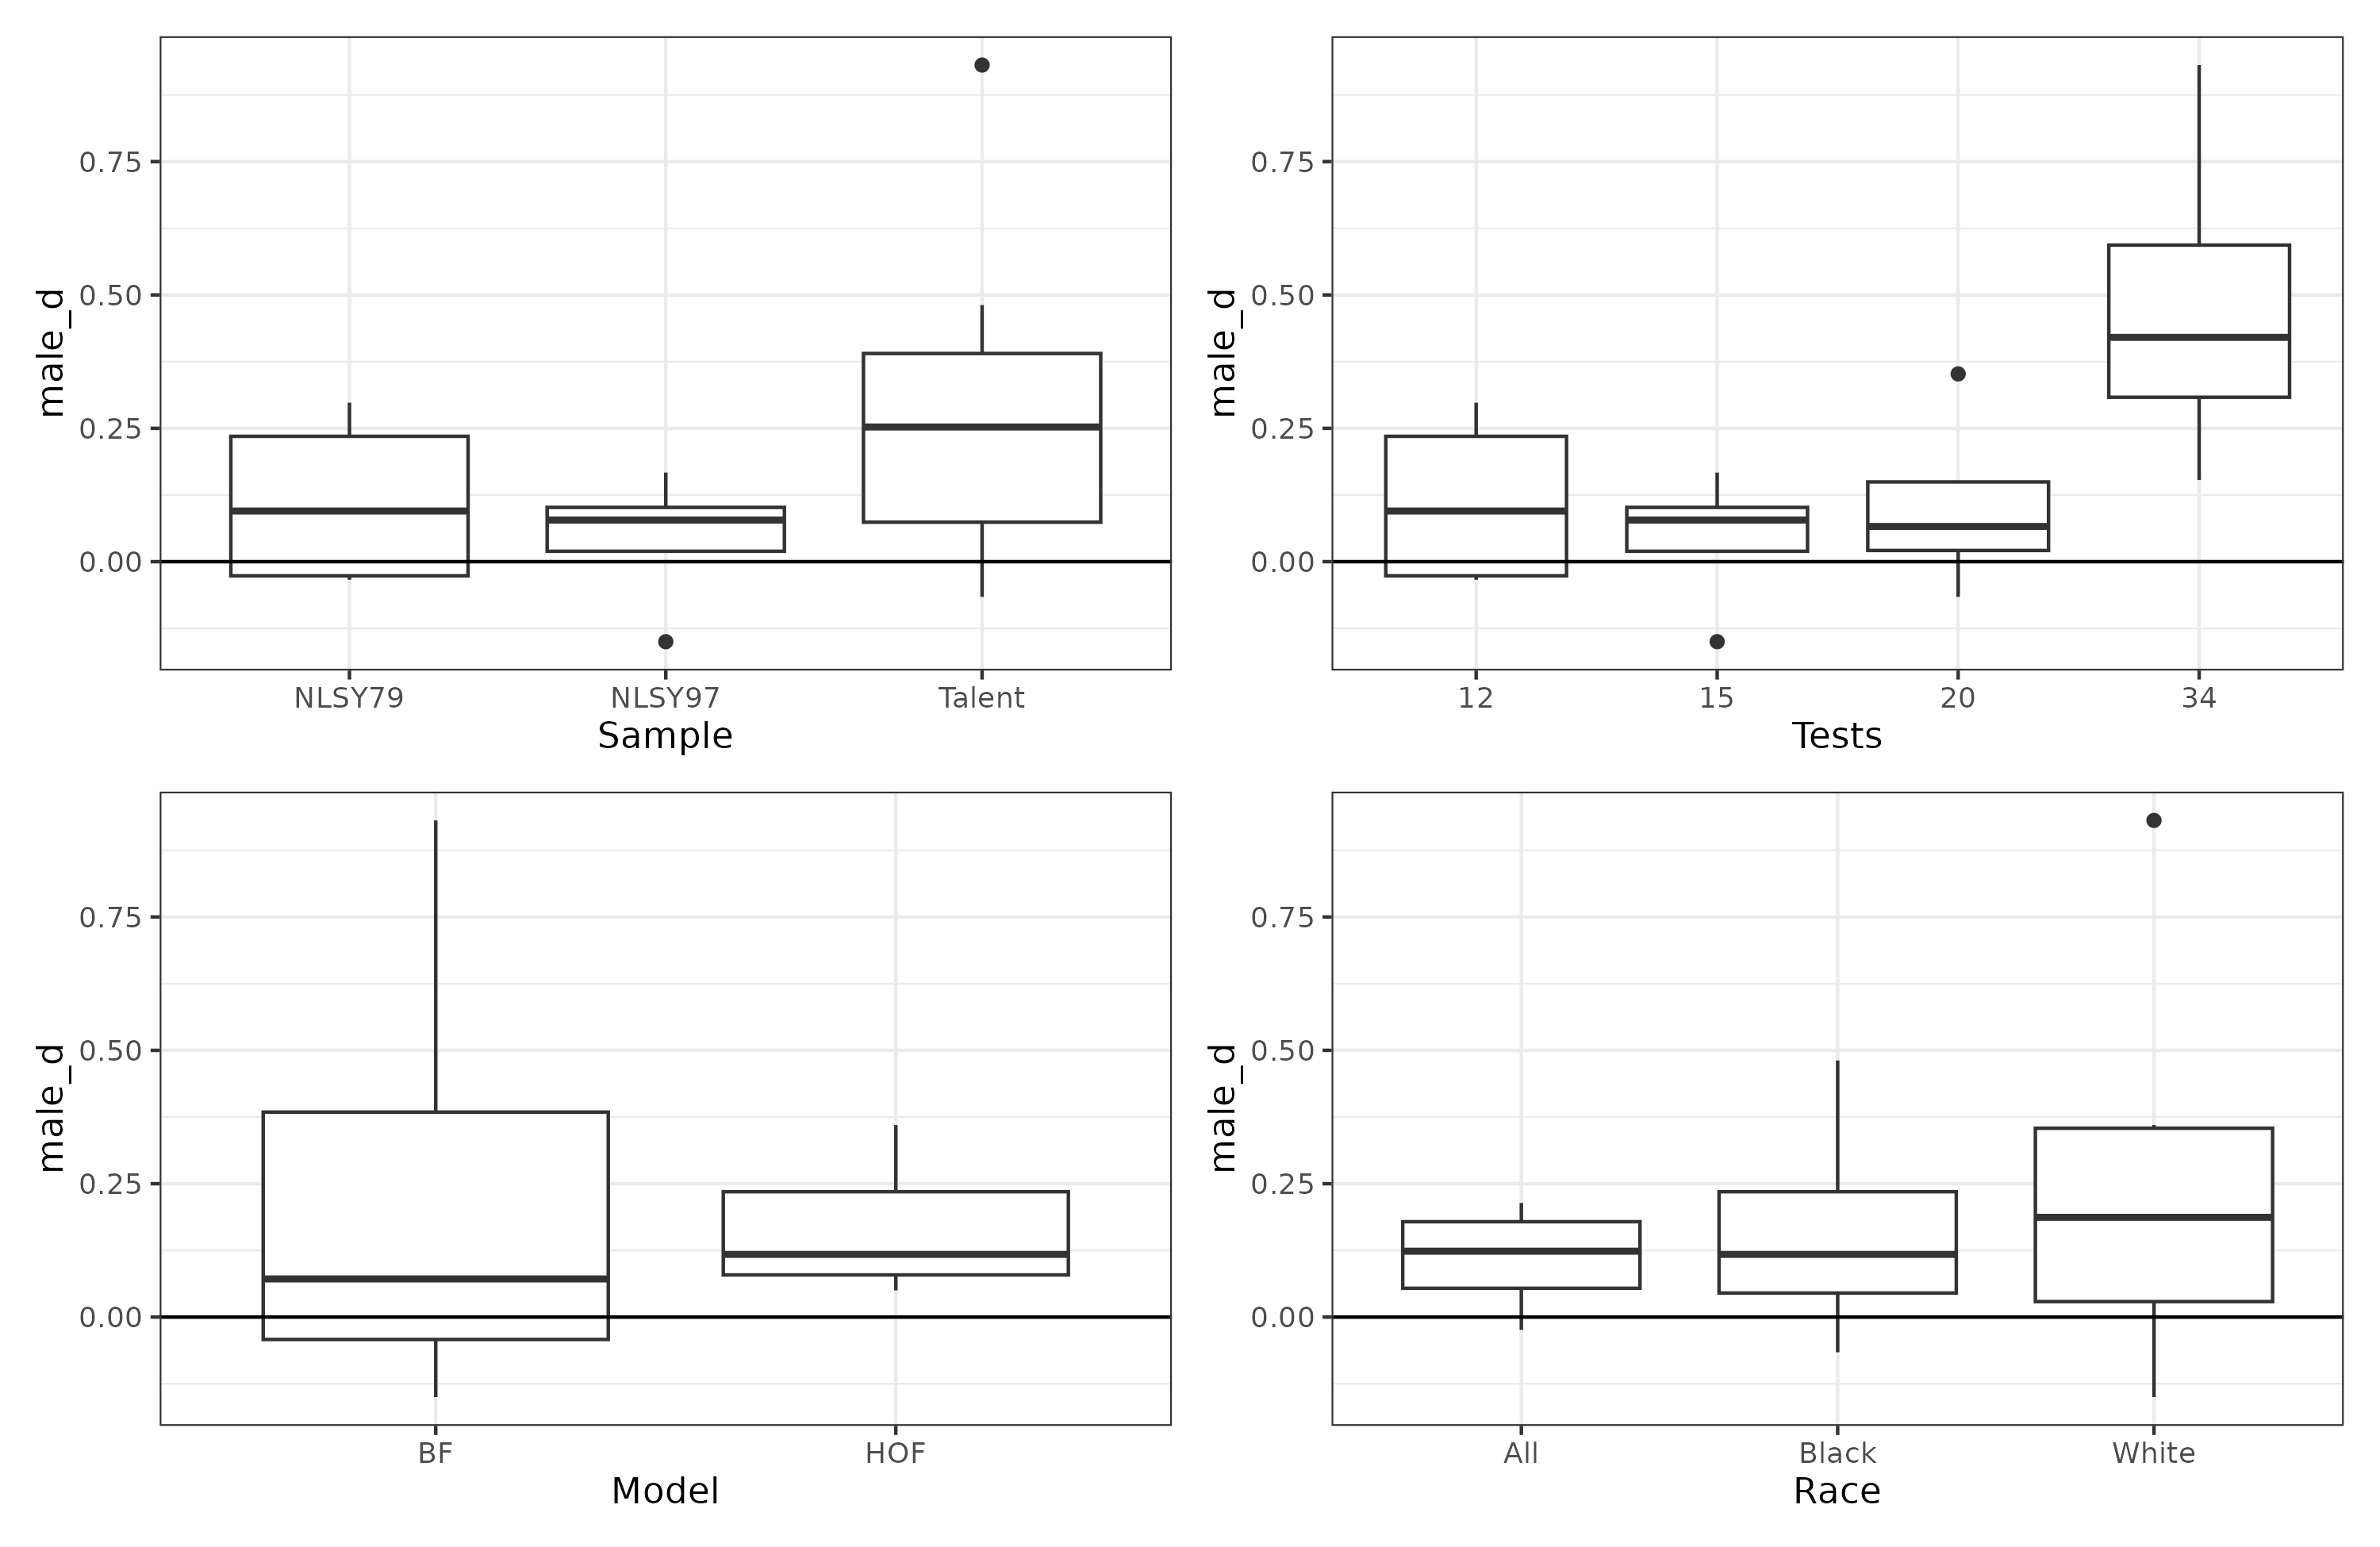
This study investigates sex differences in the general factor of intelligence and their interaction with age, using Multiple Group Confirmatory Factor Analysis (MGCFA). It aims at testing Lynn’s developmental theory of sex differences in intelligence, which states that the male advantage magnifies over the course of development, especially from age 16 onwards. The result provides some evidence for Lynn’s hypothesis in the NLSY79 and NLSY97 but not in the Project Talent. Results from the Higher Order Factor (HOF) model showed that in the NLSY79, the male advantage in g increases from 1.21 to 5.53 points in the entire sample, while in the NLSY97, the male advantage increases from 0.18 to 2.46 points in the entire sample. Similarly, results from the Bifactor (BF) model showed a greater increase in g scores across ages among males. However, the BF model often produced substantially different score gaps in g in all three datasets. This discrepancy between the HOF and BF models highlights the influence of test composition on latent scores. A sibling pair analysis in the NLSY datasets yielded ambiguous results. In the Project Talent, sex differences remained stable across ages 14-18 in the White sample, but a slight increase in female advantage was observed in the Black sample, contradicting Lynn’s hypothesis.

Keywords
IQ, measurement invariance, sex differences, Spearman’s Hypothesis, MGCFA, aptitude tests

Supplemental materials link
https://osf.io/892e3/

Pdf

Paper

Reviewers ( 0 / 2 / 0 )
Reviewer 1: Considering / Revise
Reviewer 2: Considering / Revise

Sun 09 Mar 2025 20:31

Reviewer | Admin | Editor

The issue of self-selection has been raised as a confounding factor for testing Lynn’s
hypothesis because women are more voluntary than men to take surveys.

Language issue.

Lynn, R. (2017). Sex Differences in Intelligence: The Developmental Theory. Mankind
Quarterly, 58(1), 9–42. doi: 10.46469/mq.2017.58.1.2

There is a more up to date review in:

Lynn, Richard (2021). Sex Differences in Intelligence: The Developmental Theory. Arktos Media Ltd. ISBN 978-1914208652.

In the ASVAB, tests of crystallized
ability are overly represented (Roberts et al., 2001), whereas in the Project Talent,
culture-loaded knowledge tests are overly represented (Jensen, 1985, p. 218).

Over-represented or overrepresented.

"Note: standard errors in parentheses, non-significant values are highlighted,"

Underlined.

"-fixed to 0- "

Better: 0 (fixed)

I think the best improvement to make here is to move the model fit tables to the appendix (Tables 2-7). The reader is not likely to care about various model fit statistics in detail for the numerous models. The reader is however very interested in the gap sizes in Tables A1-A3. I think you should make an overall figure from the gap tables (A1-A3). My takeaway from this study is that gap sizes are very difficult to estimate and depend on model decision making, as well as the composition. You may want to quote Jensen 1998:

Research on sex differences in mental abilities has generated hundreds of
articles in the psychological literature, with the number of studies and articles
increasing at an accelerating rate in the last decade. As there now exist many
general reviews of this literature, I will focus here on what has proved to be
the most problematic question in this field: whether, on average, males and
females differ in g.

It is noteworthy that this question, which is technically the most difficult to
answer, has been the least investigated, the least written about, and, indeed, even
the least often asked.

To examine composition effects, you could subset the tests in the batteries (e.g. 1 at a time), and notice how this changes gap sizes. Sometimes it may be difficult to do because a group factor would have fewer than 3 tests. E.g. in NLSY79, the speed factor only has 2 tests, so removing one of them would would render the latent factor just the same as the remaining single test.

Would you say your findings are more congruent with no gaps or with male advantage? If you take a Bayesian approach to this, you could analyze the male g advantage across all datasets and model specifications and look at the distribution. It looks like this distribution has non-zero tendency towards male advantage.

I did meta-analysis of your tables:

- Naive: mean = 0.19, weighted mean = 0.24, median = 0.12.
- Frequentist: 0.19, with covars = -0.16 and increases 0.027 per test included
- Bayesian: 0.28, with covars = -0.08 increases 0.03 with test number

https://rpubs.com/EmilOWK/meng_hu_2025_sex_diffs_g

Models with the full set of covariates are very underpowered (n=16, 4 predictors), but the one-at-a-time models are a bit more powered. Looks like HOF is much more consistent in general, and with higher means for men.

You can save more models with other different decisions and run a multiverse analysis. https://cran.r-project.org/web/packages/multiverse/readme/README.html

In general, though, my reading is that results are more congruent with a male advantage, but because it depends so strongly on the study covariates (model, race, sample, tests), it is hard to say anything for sure. Unfortunately, that means we didn't learn much from this major undertaking, but now we know that at least. :)

Reviewer

Overall some great empirical work, but very hard to read. The important results should be emphasised in table and graph form and clearer explainations are needed.


“The issue of self-selection has been raised as a confounding factor for testing Lynn’s

hypothesis because women are more voluntary than men to take surveys. “

  • Bad grammar, page 2


For Bifactor and HOF a diagram would be useful


Not mention of the age in the Deary et al. (2007) study (page 4)


Table 1 should have a sort of plain english column with a verbal explanation. It is currently hard to follow, flipping from table to text. Some terminology needs better explanations, possibly in a second table: Invariance, loadings, residuals etc. The models actually tested should be indicated, maybe by highlighting them in the table.


The “Data preparation and assumption tests” sections should be moved to the methodology section.


Tables A1-A3 should not be in the appendix. They are the most important results in the analysis. At the very least the g differences should be in a table in the main body. A table and graph showing differences in g at different ages in all 3 datasets should be included at the end of your results section.


Page 15: This translates to a male advantage of -3.06 and -1.02 points in IQ metric. Read literally this is saying that there is a Female advantage. Is that correct? In general, check to make sure your negative signs are all correct.


I believe that a lot of your results could be better presented as a table. For example:

 “ In the BF model, the

fully standardized intercept of g is -.136 at the mean age (14.4), and the unstandardized

regression coefficients are .306 for men and .272 for women. Given the intercept and the

difference in regression coefficients, the standardized group differences are -.204 and .068

at ages 12.4 and 16.4 ((-.136±.306*2)-(0±.272*2)). This translates to a male advantage of

-3.06 and -1.02 points in IQ metric. For the BF model that omits the verbal factor, the male

advantage increases from 2.70 to 4.32 points in IQ metric.”

This could be better presented in a table


Model

Sex difference in g at mean age

Interaction effect (sex difference in g * (age - 14.4)

Sex difference at 12.4

Sex difference at 16.4


BF

IQ metric (standardized effect)


BF omitting verbal

         
Bot

Author has updated the submission to version #2

Author | Admin

I noticed there are missing notes below the tables 3-6. I will fix that for the typesetting.

Reviewer 1:

I modified the article following your feedback. Just to be clear, about MGCFA model fit results being moved to the appendix, it's a very unusual procedure. Always the MGCFA result is displayed in the result. I moved it to the appendix still.

I didn't know what to do about your meta-analysis and thought about expanding on it, but there's absolutely nothing I can do. The test composition issue depends on what is retained/removed in the battery. Remember that in the Talent Project, the battery with 20 subtests showed smaller gaps, because the 14 subtests that have been removed showed very large male advantage (tests of scientific knowledge and social science). The real problem in the PT battery is that most tests favor males, which is why it displays such a large male advantage. I still reported the result of your analysis in the discussion section (in a footnote).


Reviewer 2:

I modified the article, followiing your feedback.

For table 1 though, I added a footnote describing the symbols, I think this should be enough. I know equations using symbols are complicated, but that is the only way to make such a table. Also, equations are just a way to summarize the paragraph that describes MGCFA steps. 

Instead of making additional tables for Lynn's test specifically, I removed the details about the calculations of the effect size, so it's much easier to read the text now.

Also, I'm not really sure if a graph would be necessary at this point. Let me know.

Reviewer | Admin | Editor

Re-reading the entire paper. Some points:

  1. Given that you reviewed a lot of studies and their findings in the introduction, it may be helpful to supply a table of results. Columns could be 1) authors (year), 2) dataset (year), 3) country, 4) method (HOF/BF/etc.), 5) male advantage in d (95ci). Using this, you can fit a simple meta-analysis (metafor in R). This would tell the reader what the overall reported findings suggest. It looked pretty mixed, but it is hard to tell whether findings lean in one direction or not. You can include method as a moderator, which would tell us whether HOF or BF tends to favor one result over another (e.g. in NLSY79 BF prefers zero gap, HOF male advange). Some datasets have results for both, which then allows one to exploit within-study variance. I also think it is good to include the naive 1-factor model as a comparison. The meta-analys should also include the results from the current study. I did this in my last reply to you.
  2. Figure 1 quality is too low. If you are drawing them using e.g. draw.io, you can export to PNG and set zoom to 200% to increase quality.