Dear Editors,
We attach a manuscript entitled, "Putting Spearman’s Hypothesis to Work: Job IQ as a Predictor of Employee Racial Composition". We ask that it be peer-reviewed for potential publication in ODP.
However, we cannot completely comply with your submission requirements, as one column in our data set (Wonderlic IQs by job) is copyrighted / proprietary.
Please advise,
Sincerely,
Bryan
Back to [Archive] Post-review discussions
In general, I don't see any large problems with this study. An idea was tested with the relevant datasets in an appropriate way.
All quotes are from the authors/the paper unless otherwise stated.
One cannot copyright datasets (https://en.wikipedia.org/wiki/Sui_generis_database_right#United_States ). This column is not copyrighted. Note that this information has already been published elsewhere, e.g. by Gottfredson (1997). This was however the old version (1992 as I recall). If you don't dare publish it, please ask Wonderlic for permission to share this dataset.
Speaking of which, did you cross-check the IQ by job with the old Wonderlic data? It may not use exactly the same job types, however. Jobs change over time, of course.
There is also a large collection of IQ by job types here: http://emilkirkegaard.dk/en/?p=5644 Most of them are not as extensive as yours.
Aside from that one column, I note that the remaining dataset is not published attached either. All data that can be shared, must be shared for publication in this journal, so I'd like the authors to please provide the dataset. The best solution is to use OSF and make a public repository: http://osf.io/
However, I will do this for the authors, if they do not have the time or expertise.
I would cite Carroll 1997 and/or Dalliard 2013 for this.
http://www.cambridge.org/us/academic/subjects/psychology/cognition/human-cognitive-abilities-survey-factor-analytic-studies
http://humanvarieties.org/2013/04/03/is-psychometric-g-a-myth/
The first being the conservative choice.
Perhaps take a look at: http://www.nature.com/nrn/journal/v11/n3/full/nrn2793.html
There are more studies too. There is a brief summary of these findings in http://emilkirkegaard.dk/en/?p=5034 (unfinished research project)
I find that hard to believe. Galton did not have any IQ tests since the first was invented by Binet some years later. He did make some rough estimates of the race groups. Perhaps that's what you have in mind?
Perhaps the most comprehensive and recent analysis is that unpublished study by Fuerst at
http://humanvarieties.org/2013/01/15/secular-changes-in-the-black-white-cognitive-ability-gap/
I told him to get it published. Let's see what happens! :)
This is ”Asian” in the US. Asian is a broad category that includes e.g. Indians. Indians in the US do very well (https://en.wikipedia.org/wiki/Indian_Americans#Socioeconomic ), and may be the top scoring group, but in India, they do very poorly (mean IQ around low 80s). You should clarify.
This claim was also made last time and it is not right. See:
http://openpsych.net/forum/showthread.php?tid=239
Think you mean status? Stature is height. Perhaps you mean it in the extended meaning of “social standing” or so.
I would definitely recommend reading:
Gordon, R. A. (1997). Everyday life as an intelligence test: Effects of intelligence and intelligence context. Intelligence, 24(1), 203-320.
http://citeseerx.ist.psu.edu/viewdoc/download?doi=10.1.1.372.8122&rep=rep1&type=pdf
Great paper. You are doing much the same. You treat the different jobs at items in a test, with their own g loadings and then do a test of Spearman's hypothesis on these.
By the way, this kind of study has been done for Academic majors (students):
http://www.sciencedirect.com/science/article/pii/S0191886902002155
It has also been done for gender, although this is more dubious due to the lack of agreement on whether there actually is a mean IQ difference or not.
You say, “we”. Did you have two coders (there are two authors)? If so, where there any disagreements about the coding? How were these resolved?
This corresponds to the low correlation found between being out of a job and IQ at the individual level. You could back-estimate this correlation using this mean. Just a minor check.
It would be better to just average the BLS values across years, no?
I also recommend reading the following paper, which is similar to yours:
McDaniel, M. A., & Kepes, S. (2014). An Evaluation of Spearman's Hypothesis by Manipulating g Saturation. International Journal of Selection and Assessment, 22(4), 333-342.
http://emilkirkegaard.dk/en/wp-content/uploads/An-Evaluation-of-Spearmans-Hypothesis-by-Manipulating-g-Saturation.pdf
This study checked SH by creating different IQ tests out of a collection of subtests. As expected, the group difference goes up the higher the g-loading of the IQ test created.
I'd like the authors to add some ideas for why the Asian% X IQ is so low. Theory-wise, it is predicted to be larger due to Asians' mean IQ being further away from the mean IQ, I think.
My ideas: 1) Asians are very clustered in certain geographic areas where not all job types are found. 2) Asians have substantially different job interests (no idea if this is true), which therefore throws the correlations off.
Note that the reliability of Asian% was just as high as that for White%/Black%, so it cannot be a reliability issue.
I'd like to authors to use multiple regression to predict the racial%'s. Perhaps the Asian% finding is due to Asians having some large preference for not working with people or preference for working with things. Multiple regression may be able to shed some light on this. Does the DOT supply full RIASEC scores by job or only the three datapoints listed?
I would like the authors to provide the effect sizes of the prior research so readers can see whether the effect sizes are similar. This is needed for cumulative science.
http://www.phil.vt.edu/dmayo/personal_website/Schmidt_StatSigTesting.pdf
All quotes are from the authors/the paper unless otherwise stated.
However, we cannot completely comply with your submission requirements, as one column in our data set (Wonderlic IQs by job) is copyrighted / proprietary.
One cannot copyright datasets (https://en.wikipedia.org/wiki/Sui_generis_database_right#United_States ). This column is not copyrighted. Note that this information has already been published elsewhere, e.g. by Gottfredson (1997). This was however the old version (1992 as I recall). If you don't dare publish it, please ask Wonderlic for permission to share this dataset.
Speaking of which, did you cross-check the IQ by job with the old Wonderlic data? It may not use exactly the same job types, however. Jobs change over time, of course.
There is also a large collection of IQ by job types here: http://emilkirkegaard.dk/en/?p=5644 Most of them are not as extensive as yours.
Aside from that one column, I note that the remaining dataset is not published attached either. All data that can be shared, must be shared for publication in this journal, so I'd like the authors to please provide the dataset. The best solution is to use OSF and make a public repository: http://osf.io/
However, I will do this for the authors, if they do not have the time or expertise.
Scores on diverse sets of mental abilities tests correlate positively.
I would cite Carroll 1997 and/or Dalliard 2013 for this.
http://www.cambridge.org/us/academic/subjects/psychology/cognition/human-cognitive-abilities-survey-factor-analytic-studies
http://humanvarieties.org/2013/04/03/is-psychometric-g-a-myth/
The first being the conservative choice.
Biologically, g likely reflects the speed and efficiency with which brains process information (Jensen, 1998, 2011; Pesta & Poznanski, 2008).
Perhaps take a look at: http://www.nature.com/nrn/journal/v11/n3/full/nrn2793.html
There are more studies too. There is a brief summary of these findings in http://emilkirkegaard.dk/en/?p=5034 (unfinished research project)
Galton (1892) first documented Black / White (e.g.) differences on cognitive tests, and these differences have persisted in the literature since then (Roth et al., 2001).
I find that hard to believe. Galton did not have any IQ tests since the first was invented by Binet some years later. He did make some rough estimates of the race groups. Perhaps that's what you have in mind?
This century, Roth et al., (2001) conducted a massive, meta-analytic summary of race / IQ differences (N = 6,246,729 people). They reported an overall Black / White effect size of 1.10.
Perhaps the most comprehensive and recent analysis is that unpublished study by Fuerst at
http://humanvarieties.org/2013/01/15/secular-changes-in-the-black-white-cognitive-ability-gap/
I told him to get it published. Let's see what happens! :)
Other racial and ethnic groups show different mean IQs. The Asian IQ mean is estimated at 106 (Rushton & Jensen, 2005).
This is ”Asian” in the US. Asian is a broad category that includes e.g. Indians. Indians in the US do very well (https://en.wikipedia.org/wiki/Indian_Americans#Socioeconomic ), and may be the top scoring group, but in India, they do very poorly (mean IQ around low 80s). You should clarify.
The digit span task is a classic example illustrating this effect. Here, the tester vocalizes a random number string (e.g., 5, 4, 7, 1, 9) at the rate of one number per second. The respondent then immediately attempts to recall each number in either forward (i.e., 5, 4, 7, 1, 9) or backward (i.e., 9, 1, 7, 4, 5) serial order. The backward version is roughly twice as g-loaded as the forward version, and it produces roughly twice as large a difference across Black / White groups (Jensen & Figueroa, 1976).
This claim was also made last time and it is not right. See:
http://openpsych.net/forum/showthread.php?tid=239
Lower scores on a DOT element indicate higher complexity and / or stature.
Think you mean status? Stature is height. Perhaps you mean it in the extended meaning of “social standing” or so.
Tying together IQ, race, and job complexity, we return to the method of correlated vectors. We argue that a job is analogous to a mental test. Different jobs require different IQs (i.e., levels of g) to perform successfully. A novel test of Spearman’s hypothesis is to use the IQ of various jobs as predictors of the racial composition of their employees. If Spearman’s hypothesis is correct, as job IQ increases, the percentage of Black workers holding the job should decrease (but the percentage of White and Asian workers should increase). The opposite is predicted as job IQ decreases.
I would definitely recommend reading:
Gordon, R. A. (1997). Everyday life as an intelligence test: Effects of intelligence and intelligence context. Intelligence, 24(1), 203-320.
http://citeseerx.ist.psu.edu/viewdoc/download?doi=10.1.1.372.8122&rep=rep1&type=pdf
Great paper. You are doing much the same. You treat the different jobs at items in a test, with their own g loadings and then do a test of Spearman's hypothesis on these.
By the way, this kind of study has been done for Academic majors (students):
http://www.sciencedirect.com/science/article/pii/S0191886902002155
It has also been done for gender, although this is more dubious due to the lack of agreement on whether there actually is a mean IQ difference or not.
We coded all but percent-Hispanic, as the BLS considers this group to be an ethnicity versus a race. That is, people in the BLS’ Hispanic category could be either White, Black or neither race. We also coded the identical data set for the year 2012 (BLS, 2013). We did this to cross-validate results found with the 2014 data, and to test whether the demographic content of different jobs is stable across years.
You say, “we”. Did you have two coders (there are two authors)? If so, where there any disagreements about the coding? How were these resolved?
Although the effect is not large, the mean IQ of all jobs, 104.5, is higher than the population IQ mean of 100 for individuals. We speculate this is likely because there are not many jobs with considerably low IQ requirements. That is, few jobs exist where the minimum IQ is in the 10th or 15th percentile. Consistent with this is the fact that the lower one’s IQ, the less likely he or she is to be in the labor force (see, e.g., Gottfredson, 2003; Herrnstein & Murray, 1994). At any rate, the mean value of 104.5 represents the population parameter for all jobs listed in the Wonderlic (2002) test manual.
This corresponds to the low correlation found between being out of a job and IQ at the individual level. You could back-estimate this correlation using this mean. Just a minor check.
As a cross check on validity, we correlated these same variables, but used the 2012 BLS data. The correlations were .46, -.57, and .20 respectively. Also, the 2012 and 2014 BLS data showed very strong stability in the demographic makeup of jobs over a two-year period. The correlations were .88, .87 and .87 for percent White, Black, and Asian (paired as 2012 and 2014 values), respectfully.
It would be better to just average the BLS values across years, no?
I also recommend reading the following paper, which is similar to yours:
McDaniel, M. A., & Kepes, S. (2014). An Evaluation of Spearman's Hypothesis by Manipulating g Saturation. International Journal of Selection and Assessment, 22(4), 333-342.
http://emilkirkegaard.dk/en/wp-content/uploads/An-Evaluation-of-Spearmans-Hypothesis-by-Manipulating-g-Saturation.pdf
This study checked SH by creating different IQ tests out of a collection of subtests. As expected, the group difference goes up the higher the g-loading of the IQ test created.
We found consistent support for this hypothesis. As job IQ increased, the percent of Black workers decreased. Conversely, the percent of White and Asian workers increased. Although the correlation was small for Asians, it was non-trivial for Whites, and large for Blacks. Spearman’s hypothesis is therefore supported in a novel way.
I'd like the authors to add some ideas for why the Asian% X IQ is so low. Theory-wise, it is predicted to be larger due to Asians' mean IQ being further away from the mean IQ, I think.
My ideas: 1) Asians are very clustered in certain geographic areas where not all job types are found. 2) Asians have substantially different job interests (no idea if this is true), which therefore throws the correlations off.
Note that the reliability of Asian% was just as high as that for White%/Black%, so it cannot be a reliability issue.
I'd like to authors to use multiple regression to predict the racial%'s. Perhaps the Asian% finding is due to Asians having some large preference for not working with people or preference for working with things. Multiple regression may be able to shed some light on this. Does the DOT supply full RIASEC scores by job or only the three datapoints listed?
Consistent with past research (Gottfredson, 1986; 2003; Schmidt & Hunter, 2004), we found that job complexity and IQ are strongly related. The DOT element, Data, correlated very strongly with job IQs as reported by the Wonderlic (2002). The People (but not Things) element was also a non-trivial predictor of job IQ. Again, job complexity and IQ are intrinsically linked.
I would like the authors to provide the effect sizes of the prior research so readers can see whether the effect sizes are similar. This is needed for cumulative science.
http://www.phil.vt.edu/dmayo/personal_website/Schmidt_StatSigTesting.pdf
Thanks for the prompt and fair review. I will be addressing concerns piecemeal over the next few days. Here, I attach the data file. Based on your comment, I decided to indeed include the IQ scores. It's SPSS and I hope it's easy to convert.
Bryan
Bryan
Sounds good.
I have converted the data to CSV format (program neutral) and uploaded the files to an OSF repository. If the authors make users on OSF, I will transfer control of the repository to them.
https://osf.io/pxmjc/files/
I have converted the data to CSV format (program neutral) and uploaded the files to an OSF repository. If the authors make users on OSF, I will transfer control of the repository to them.
https://osf.io/pxmjc/files/
This was a straightforward, clever analysis detailed by a remarkably lucid write up. I just have a few nitpicks:
There is some semantic sloppiness here regarding the race/ethnic classifications. For example, Galton's Blacks (Sub-Saharan Africans) are not the same as U.S. Blacks either culturally or genealogically -- the latter being admixed. And U.S. Asians, a gallimaufry of peoples from a vast continent, are not the same as Rushton & Jensen's (2005) North East Asians. Reword this section.
Maybe additionally clarify the groupings e.g., "race and ethnicity as defined by the Office of Management and Budget, groups defined in term of regional ancestry" or however this is typically done in IO psych, if it is.
In practice, SH refers to "weak" SH according to which differences "mainly" reflect g differences.
To cover bases, maybe add a cf. and cite e.g., Dolan, C. V. (2000). Investigating Spearman's hypothesis by means of multi-group confirmatory factor analysis. Multivariate Behavioral Research, 35(1), 21-50.
"Should" assuming, as Gottfredson noted, minimal social interventions.
So you couldn't code for Hispanics or you didn't? I don't see why the ethnicity/race distinction would matters, as SH is thought to hold for Hispanics as an ethnic group. Or was the relevant data missing?
Maybe note whether the associations were stronger or weaker than what Gottfredson found. I recall she predicted that they would be attenuated owing to e.g., affirmative action for medical school. (In Gottfredson (1987) she notes that she found a r(cognitive complexity x B/W ratio) of -.5 or so.)
Gottfredson, L. S. (1986). Societal consequences of the g factor in employment. Journal of Vocational Behavior, 29, 379-410.
Gottfredson, L. S. (1987). The practical significance of black-white differences in intelligence. Behavioral and Brain Sciences, 10 (3), 510-512.
It would be interesting to see the fields for which there were strong deviations from the expected employment ratios. Maybe a figure with B/W employment ratios on one axis and cognitive complexity on the other. (I'm not asking you to include such a figure; but just noting that I would be interested in seeing one.)
Race groups differ... Galton (1892) first documented Black / White (e.g.) differences on cognitive tests...The Asian IQ mean is estimated at 106 (Rushton & Jensen, 2005)... individuals of different races.
There is some semantic sloppiness here regarding the race/ethnic classifications. For example, Galton's Blacks (Sub-Saharan Africans) are not the same as U.S. Blacks either culturally or genealogically -- the latter being admixed. And U.S. Asians, a gallimaufry of peoples from a vast continent, are not the same as Rushton & Jensen's (2005) North East Asians. Reword this section.
Maybe additionally clarify the groupings e.g., "race and ethnicity as defined by the Office of Management and Budget, groups defined in term of regional ancestry" or however this is typically done in IO psych, if it is.
A parsimonious explanation for race / IQ differences is Spearman's hypothesis (Spearman, 1927; see also, Jensen 1985). It proposes that IQ differences are g differences.
In practice, SH refers to "weak" SH according to which differences "mainly" reflect g differences.
The literature strongly supports Spearman’s hypothesis (for reviews, see, e.g., Jensen, 1998; Rushton & Jensen, 2005).
To cover bases, maybe add a cf. and cite e.g., Dolan, C. V. (2000). Investigating Spearman's hypothesis by means of multi-group confirmatory factor analysis. Multivariate Behavioral Research, 35(1), 21-50.
If Spearman’s hypothesis is correct, as job IQ increases, the percentage of Black workers holding the job should decrease (but the percentage of White and Asian workers should increase).
"Should" assuming, as Gottfredson noted, minimal social interventions.
We coded all but percent-Hispanic, as the BLS considers this group to be an ethnicity versus a race. That is, people in the BLS’ Hispanic category could be either White, Black or neither race.
So you couldn't code for Hispanics or you didn't? I don't see why the ethnicity/race distinction would matters, as SH is thought to hold for Hispanics as an ethnic group. Or was the relevant data missing?
Maybe note whether the associations were stronger or weaker than what Gottfredson found. I recall she predicted that they would be attenuated owing to e.g., affirmative action for medical school. (In Gottfredson (1987) she notes that she found a r(cognitive complexity x B/W ratio) of -.5 or so.)
Gottfredson, L. S. (1986). Societal consequences of the g factor in employment. Journal of Vocational Behavior, 29, 379-410.
Gottfredson, L. S. (1987). The practical significance of black-white differences in intelligence. Behavioral and Brain Sciences, 10 (3), 510-512.
It would be interesting to see the fields for which there were strong deviations from the expected employment ratios. Maybe a figure with B/W employment ratios on one axis and cognitive complexity on the other. (I'm not asking you to include such a figure; but just noting that I would be interested in seeing one.)
Emil:
I typed my reply in Word, all nicely formatted. Pasting it in here, though, was a mess, and so I attach the Word file. Hope this is ok.
Bryan
I typed my reply in Word, all nicely formatted. Pasting it in here, though, was a mess, and so I attach the Word file. Hope this is ok.
Bryan
Thanks for the review!
-Attachment
-Attachment
This was a straightforward, clever analysis detailed by a remarkably lucid write up. I just have a few nitpicks:Race groups differ... Galton (1892) first documented Black / White (e.g.) differences on cognitive tests...The Asian IQ mean is estimated at 106 (Rushton & Jensen, 2005)... individuals of different races.
There is some semantic sloppiness here regarding the race/ethnic classifications. For example, Galton's Blacks (Sub-Saharan Africans) are not the same as U.S. Blacks either culturally or genealogically -- the latter being admixed. And U.S. Asians, a gallimaufry of peoples from a vast continent, are not the same as Rushton & Jensen's (2005) North East Asians. Reword this section.
Maybe additionally clarify the groupings e.g., "race and ethnicity as defined by the Office of Management and Budget, groups defined in term of regional ancestry" or however this is typically done in IO psych, if it is.A parsimonious explanation for race / IQ differences is Spearman's hypothesis (Spearman, 1927; see also, Jensen 1985). It proposes that IQ differences are g differences.
In practice, SH refers to "weak" SH according to which differences "mainly" reflect g differences.The literature strongly supports Spearman’s hypothesis (for reviews, see, e.g., Jensen, 1998; Rushton & Jensen, 2005).
To cover bases, maybe add a cf. and cite e.g., Dolan, C. V. (2000). Investigating Spearman's hypothesis by means of multi-group confirmatory factor analysis. Multivariate Behavioral Research, 35(1), 21-50.If Spearman’s hypothesis is correct, as job IQ increases, the percentage of Black workers holding the job should decrease (but the percentage of White and Asian workers should increase).
"Should" assuming, as Gottfredson noted, minimal social interventions.We coded all but percent-Hispanic, as the BLS considers this group to be an ethnicity versus a race. That is, people in the BLS’ Hispanic category could be either White, Black or neither race.
So you couldn't code for Hispanics or you didn't? I don't see why the ethnicity/race distinction would matters, as SH is thought to hold for Hispanics as an ethnic group. Or was the relevant data missing?
Maybe note whether the associations were stronger or weaker than what Gottfredson found. I recall she predicted that they would be attenuated owing to e.g., affirmative action for medical school. (In Gottfredson (1987) she notes that she found a r(cognitive complexity x B/W ratio) of -.5 or so.)
Gottfredson, L. S. (1986). Societal consequences of the g factor in employment. Journal of Vocational Behavior, 29, 379-410.
Gottfredson, L. S. (1987). The practical significance of black-white differences in intelligence. Behavioral and Brain Sciences, 10 (3), 510-512.
It would be interesting to see the fields for which there were strong deviations from the expected employment ratios. Maybe a figure with B/W employment ratios on one axis and cognitive complexity on the other. (I'm not asking you to include such a figure; but just noting that I would be interested in seeing one.)
"Reply: Would this be something like affirmative action? The revision didn’t address this issue."
I was suggesting that you might qualify your statement. For example, for precision, I might say: Spearman's hypothesis would predict that group differences are larger on more g-loaded tests, assuming no countervailing psychometric bias. Likewise: Spearman's hypothesis would predict that employment differences are larger for more g-loaded fields, assuming no countervailing societal bias e.g., affirmative action or defacto quotas. If you think that the qualification is obvious, don't bother.
"Reply: Unfortunately, we have no data on Hispanics. The USBLS allows people of any race to self-identify as Hispanic. So, that category included both black- and white-Hispanic people."
I don't see a sound justification for the exclusion.
(1) "Hispanics" are defined as a multi-racial ethnic group by the census (Directive 15). Both national samples, such as the NLSY79/97, and IQ standardization samples adopt this understanding.
(2) Spearman's hypothesis has been proposed to hold for and has been tested on "Hispanics" (a cultural groups), not just Amerindians (a racial group).
(3) The "Hispanic" group is not atypically defined, relative to common social science practice; rather "Whites" "Blacks" and "Asians" are since these typically refer to e.g., "non-Hispanic Whites" in the literature. (Or is the situation different in IO?)
(4) The relatively problematic delineation of e.g., "Whites" is not a problem for SH, since SH, as now formulated, simply proposes that "group differences are a function of g loadings", thus it is applicable to all sorts of culturally and politically delineated groups, which is why you can see if it hold for "Asians" (a clearly politically defined group, which has no cultural, linguistic, or genetic basis).
Unless you can come up with a better reason, add Hispanics.
I was suggesting that you might qualify your statement. For example, for precision, I might say: Spearman's hypothesis would predict that group differences are larger on more g-loaded tests, assuming no countervailing psychometric bias. Likewise: Spearman's hypothesis would predict that employment differences are larger for more g-loaded fields, assuming no countervailing societal bias e.g., affirmative action or defacto quotas. If you think that the qualification is obvious, don't bother.
"Reply: Unfortunately, we have no data on Hispanics. The USBLS allows people of any race to self-identify as Hispanic. So, that category included both black- and white-Hispanic people."
I don't see a sound justification for the exclusion.
(1) "Hispanics" are defined as a multi-racial ethnic group by the census (Directive 15). Both national samples, such as the NLSY79/97, and IQ standardization samples adopt this understanding.
(2) Spearman's hypothesis has been proposed to hold for and has been tested on "Hispanics" (a cultural groups), not just Amerindians (a racial group).
Warne, R. T. (2016). Testing Spearman's hypothesis with advanced placement examination data. Intelligence.
The nature, source, and meaning of average group score differences between demographic groups on cognitive tests has been a source of controversy for decades. One possible explanation is “Spearman's hypothesis,” which states that the magnitude of score differences across demographic groups is a direct function of how strongly the test measures g.... In this study I used the method of correlated vectors to examine the relationship between racial/ethnic group differences of Advanced Placement (AP) exam scores and the correlation between those AP exam scores and a test of general cognitive ability, the PSAT. Results are consistent with Spearman's hypothesis for White-Black and White-Hispanic comparisons, but not for White-Asian comparisons.
(3) The "Hispanic" group is not atypically defined, relative to common social science practice; rather "Whites" "Blacks" and "Asians" are since these typically refer to e.g., "non-Hispanic Whites" in the literature. (Or is the situation different in IO?)
(4) The relatively problematic delineation of e.g., "Whites" is not a problem for SH, since SH, as now formulated, simply proposes that "group differences are a function of g loadings", thus it is applicable to all sorts of culturally and politically delineated groups, which is why you can see if it hold for "Asians" (a clearly politically defined group, which has no cultural, linguistic, or genetic basis).
Unless you can come up with a better reason, add Hispanics.
Asians, as a group, does have a genetic basis, but it would be complicated to use because one would then have to include Native Americans and Eskimos (who are sometimes, sometimes not considered part of the US "Asian" category). Furthermore, many migrants from Latin/South America would also be classified as majority Asian by genomic analysis. So, yeah, it would be complicated, but doable to some degree.
Asians, as a group, does have a genetic basis
No.
"Asian", in this context, is a class (one which includes: South Asians and East Asians) in a socio"racial" classification, one which has the following other divisions: Blacks and "Whites" (meaning: West Eurasians). By what set of genes could one arrange (classify) almost all of our "Asians" into their census class as opposed to that of Blacks and West Eurasians?
(One would have to reduce the class k to 2: (a) Blacks and (b) (East + South) + West Eurasians (i.e., out of Africans)).
My problem is that Hispanic is a category not mutually exclusive with Black, White, or Asian. The later three categories, however, are mutually exclusive with each other.
Specifically, in the BLS data set, anyone in the White category (e.g.,) is not also counted in either the Black or Asian category. In the Hispanic category, though, everyone is also counted as some other race (e.g., White and Hispanic).
So Black, White, and Asian (plus misc other races with small N) sum to 100% of the labor force. Hispanic labor force participation was then coded and reported separately as a subset of the original 100% of the races.
I'm thus really not comfortable coding, reporting, and interpreting data from this fourth group, whose composition is an unknown blend of the other three (race) groups, and whose numbers are also represented as counts in other race categories.
I hope I'm explaining this well,
Bryan
My problem is that Hispanic is a category not mutually exclusive with Black, White, or Asian. The later three categories, however, are mutually exclusive with each other.
I'm thus really not comfortable coding, reporting, and interpreting data from this fourth group, whose composition is an unknown blend of the other three (race) groups, and whose numbers are also represented as counts in other race categories.
Hi Brian,
My mind must be fuzzy. Maybe Emil can jump in and help explain.
As I noted, "Hispanics" are generally delineated that way. What is somewhat unusual is the delineation of the Black, White, and Asian groups, from which, in this case, Latin American origin people are NOT excluded. But, since you are using simple correlations, why would the atypical delineation of the latter groups matter?
Currently you are using:
e.g., White/(White+Asian + Black)
Which is:
(non-Hispanic White + Hispanic White)/(total population - "other races")
But ideally, if you had the data, you would use:
e.g., non-Hispanic White/(total population - "other races")
And I'm just asking for, additionally:
Hispanic/(White+ Asian + Black)
Which is:
Hispanic/(total population - "other races")
The denominator is the same!
He is not using ratios, he is using the plain percentages.
"White%" not for instance "White%/Black%".
He is not using ratios, he is using the plain percentages.
"White%" not for instance "White%/Black%".
Emil,
The raw %s are out of the total population:
%Hispanic/total population
%White*/total population (*White_Hispanic + White_nonHispanic)
So one would still have the same denominator, allowing for statistical comparability.
Regardless, I won't push the matter. Doing so would be akin to requesting that the authors also look at e.g., gender differences by job cognitive complexity and people orientednees. If someone wants to conduct a followup, and expand the scope of analysis, they can.
Bryan,
Did you post an updated copy somewhere? I would like to peruse the rewritten sections.
Asians, as a group, does have a genetic basis
No.
"Asian", in this context, is a class (one which includes: South Asians and East Asians) in a socio"racial" classification, one which has the following other divisions: Blacks and "Whites" (meaning: West Eurasians). By what set of genes could one arrange (classify) almost all of our "Asians" into their census class as opposed to that of Blacks and West Eurasians?
(One would have to reduce the class k to 2: (a) Blacks and (b) (East + South) + West Eurasians (i.e., out of Africans)).
After internal discussion. I now agree with John. Indians go into the west Eurasian cluster and thus cannot be grouped with the other Asians genetically without violating the rules of cladistics.
Bryan,
Quotes are yours unless otherwise specified.
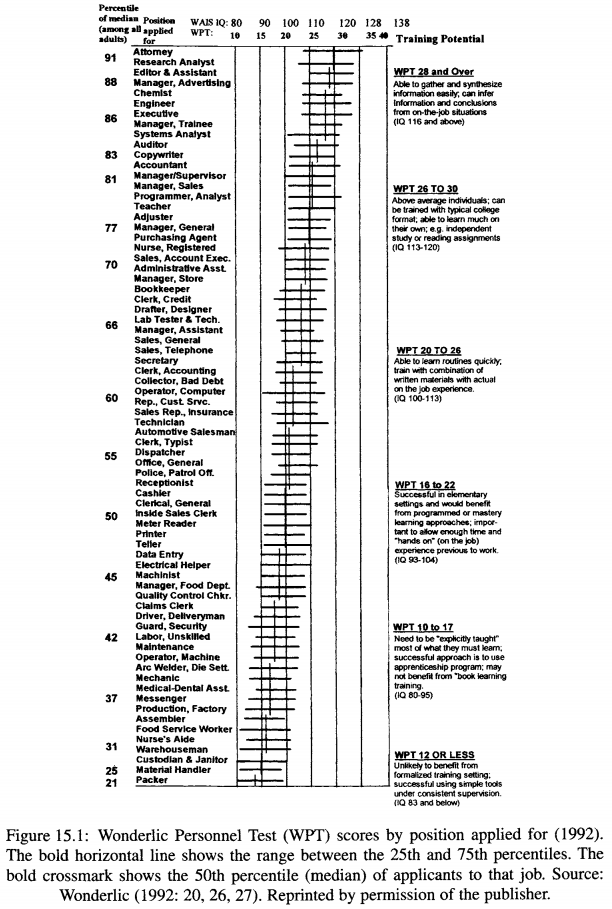
Older Wonderlic data is given by Gottfredson's classic 1997 paper. It was in my link.
Old Wonderlic data from Gottfredson.
No. Please see the discussion about your previous submission. The BDS does not have twice the g-loading of FDS. Dalliard and myself compiled several studies to show this, yet you made the same exact claim in your next submission. I find that odd.
One could use a simple cutoff based model, which assumes that everybody above a certain cutoff are in work and everybody below is not. One could also use a more gradual change, but I didn't have a ready made function for this.
These are aggregated data, so one should use the weighted mean IQ, weighted by occupation population. These are not given in your datafile, so I could not do this.
I tried with the given number, but this produced a correlation of .67, which is much too strong. So my proposed method doesn't work. Just ignore this.
(code for this is found in my R code)
You misunderstood. I proposed that you use the average of the BLS 2014 and 2012 values to remove some of the slight 'measurement error'.
I did this in my replication.
1)
Not controlling for known confounds (interests in this case) which you already have the data for is not really defensible. After all, you are interested in the effect of cognitive ability itself, not whatever it is that it happens to be correlated with. If you use correlations, you will get a confounded estimate of the influence of cognitive ability itself.
2)
Merely looking for p < alpha vs. p > alpha results is not a good way of doing science. What matters is whether the numbers fit in size. Please see: http://www.phil.vt.edu/dmayo/personal_website/Schmidt_StatSigTesting.pdf
3)
By your reasoning, White% should produce the weakest correlation, yet it does not.
Your correlations are effect sizes, yes. However, I asked for "the effect sizes of the prior research so readers can see whether the effect sizes are similar".
You present some new results. What the readers need to know is whether they fit in size with the previous results. For instance, if you find r = .20 and previous studies have found r = .95, something is wrong somewhere.
The data variable (complexity) was correlated with mean IQ at .86 in your study. You cite:
Gottfredson, L. S. (1986). Occupational aptitude patterns map: Development and implications for a theory of job aptitude requirements (Monograph). Journal of Vocational Behavior, 29, 254-291.
Gottfredson, L. S. (2003). g, jobs, and life. In H. Nyborg (Ed.), The scientific study of general intelligence: Tribute to Arthur R. Jensen (pp. 293-342). New York: Pergamon.
However, I could not find any complexity x mean IQ correlation in these papers. She does give job mean IQs and presents factor analysis results of job attributes, but does not appear to actually correlate them. Maybe I missed the number somewhere?
--
Data analysis
I replicated the authors' analysis and also did the required additional multiple regression analyses. I furthermore did some path models too, which allow for more precise causal modeling.
I used the average race% values from the BLS (2012 and 2014) to increase reliability. This results in the following correlations:
Note that I have included "other", which is the residual group. This is some mix of Native Americans, Hispanics, mixed race persons and so on. The mean IQ of this group is usually found to be somewhat below the population mean (around 95), so one would expect a negative correlation, which is also found.
John prefers the rationized group proportions (for the lack of a better term). In this way the influence of the "other" group is removed. So, for Whites this is simply White% / (White% + Black% + Asian%). Same for the others. These correlations are:
So this correction made little difference and seems unnecessary.
Of more interest are multiple regressions where we take the other job data into account. I used cognitive ability, people and things to predict each of the race%.
For Whites:
Blacks:
Asians:
Notice the very low cross-validated R2. This is suspicious.
So, to recap, the standardized betas for the races with the other job predictors were:
White: .39
Black: -.60
Asian: .41
Other: -.54
Thus, the Asian result is not really an outlier once one takes into account their higher preference for working with people (people beta = .34). Note that White has a people beta at -.19, but it's not a reliable finding (cf. the confidence interval). Still, this means that Whites and Asians are pretty different on this preference, apparently.
Path models
Here one can stipulate the causal order of variables (kind of). I specified that the interests are caused by cognitive ability and that the race% are caused jointly by cognitive ability requirement and interests.
Here's the plots:
White:
[attachment=726]
Black:
[attachment=727]
Asian:
[attachment=728]
Other:
[attachment=729]
Looking at these we see that the results for the cognitive ability paths are consistent with the other results. Direct paths: .38, -.51, .23, -.51. For Asian and White there are opposite direction indirect paths thru the people interest as seen before.
--
Code for my replication is in the OSF folder "Emil_replication".
https://osf.io/pxmjc/files/
Quotes are yours unless otherwise specified.
REPLY: We did not cross-check jobs, but instead relied on the Wonderlic’s ability and expertise at generating estimated IQs for different jobs. Also, we didn’t have older Wonderlic data, and suspect—as you point out—that matching jobs might be frustrating.
Older Wonderlic data is given by Gottfredson's classic 1997 paper. It was in my link.
Old Wonderlic data from Gottfredson.
REPLY: Would it be ok to include “(but, see, <your link>)” immediately after the word “version” in our quote above? If not, we can delete this entire section.
No. Please see the discussion about your previous submission. The BDS does not have twice the g-loading of FDS. Dalliard and myself compiled several studies to show this, yet you made the same exact claim in your next submission. I find that odd.
This (the slightly higher mean IQ among the occupations) corresponds to the low correlation found between being out of a job and IQ at the individual level. You could back-estimate this correlation using this mean. Just a minor check.
REPLY: Not sure how to do this. If desired for our paper, could you please advise?
One could use a simple cutoff based model, which assumes that everybody above a certain cutoff are in work and everybody below is not. One could also use a more gradual change, but I didn't have a ready made function for this.
These are aggregated data, so one should use the weighted mean IQ, weighted by occupation population. These are not given in your datafile, so I could not do this.
I tried with the given number, but this produced a correlation of .67, which is much too strong. So my proposed method doesn't work. Just ignore this.
(code for this is found in my R code)
It would be better to just average the BLS values across years, no?
REPLY: Correlations seem more intuitive? The rank ordering of jobs by ethnic composition is pretty much the same across a two year span.
You misunderstood. I proposed that you use the average of the BLS 2014 and 2012 values to remove some of the slight 'measurement error'.
I did this in my replication.
REPLY: In addition to your hypotheses, we wonder about a potential floor effect on the percentage of Asians in each job. We’d prefer not to complicate the manuscript by addressing why the %Asian correlation was lower than might be expected (it was nonetheless non-trivial and significant). This might be an interesting question for an additional study, but the present study just predicted a significant/non-zero correlation between %Asian and IQ. Although the correlation was smallish, its existence was predicted by Spearman’s hypothesis (and testing this hypothesis was the purpose of our study). Also, since our data are just for the USA, wouldn’t a group six points above average IQ produce smaller over/under-representation relative to a group 15 points below average IQ?
1)
Not controlling for known confounds (interests in this case) which you already have the data for is not really defensible. After all, you are interested in the effect of cognitive ability itself, not whatever it is that it happens to be correlated with. If you use correlations, you will get a confounded estimate of the influence of cognitive ability itself.
2)
Merely looking for p < alpha vs. p > alpha results is not a good way of doing science. What matters is whether the numbers fit in size. Please see: http://www.phil.vt.edu/dmayo/personal_website/Schmidt_StatSigTesting.pdf
3)
By your reasoning, White% should produce the weakest correlation, yet it does not.
REPLY: Our correlational values are effect sizes, we think. Schmidt and Hunter’s paper was a meta-analysis and so reported effect sizes. Beyond reporting correlations, I’m not sure that Gottfredson calculated effect sizes. If I’m misinterpreting what you’re asking for here, please let me know.
Your correlations are effect sizes, yes. However, I asked for "the effect sizes of the prior research so readers can see whether the effect sizes are similar".
You present some new results. What the readers need to know is whether they fit in size with the previous results. For instance, if you find r = .20 and previous studies have found r = .95, something is wrong somewhere.
The data variable (complexity) was correlated with mean IQ at .86 in your study. You cite:
Gottfredson, L. S. (1986). Occupational aptitude patterns map: Development and implications for a theory of job aptitude requirements (Monograph). Journal of Vocational Behavior, 29, 254-291.
Gottfredson, L. S. (2003). g, jobs, and life. In H. Nyborg (Ed.), The scientific study of general intelligence: Tribute to Arthur R. Jensen (pp. 293-342). New York: Pergamon.
However, I could not find any complexity x mean IQ correlation in these papers. She does give job mean IQs and presents factor analysis results of job attributes, but does not appear to actually correlate them. Maybe I missed the number somewhere?
--
Data analysis
I replicated the authors' analysis and also did the required additional multiple regression analyses. I furthermore did some path models too, which allow for more precise causal modeling.
I used the average race% values from the BLS (2012 and 2014) to increase reliability. This results in the following correlations:
          iq white black asian other  data people things
iq      1.00  0.48 -0.61  0.23 -0.51 -0.86  -0.53   0.04
white   0.48  1.00 -0.85 -0.38 -0.49 -0.52  -0.37  -0.04
black  -0.61 -0.85  1.00 -0.14  0.47  0.66   0.30   0.09
asian   0.23 -0.38 -0.14  1.00 -0.14 -0.21   0.13  -0.07
other  -0.51 -0.49  0.47 -0.14  1.00  0.45   0.24  -0.04
data   -0.86 -0.52  0.66 -0.21  0.45  1.00   0.50  -0.01
people -0.53 -0.37  0.30  0.13  0.24  0.50   1.00  -0.24
things  0.04 -0.04  0.09 -0.07 -0.04 -0.01  -0.24   1.00
Note that I have included "other", which is the residual group. This is some mix of Native Americans, Hispanics, mixed race persons and so on. The mean IQ of this group is usually found to be somewhat below the population mean (around 95), so one would expect a negative correlation, which is also found.
John prefers the rationized group proportions (for the lack of a better term). In this way the influence of the "other" group is removed. So, for Whites this is simply White% / (White% + Black% + Asian%). Same for the others. These correlations are:
               iq white_ratio black_ratio asian_ratio  data people things
iq           1.00        0.44       -0.61        0.22 -0.86  -0.53   0.04
white_ratio  0.44        1.00       -0.84       -0.42 -0.49  -0.35  -0.04
black_ratio -0.61       -0.84        1.00       -0.14  0.66   0.30   0.09
asian_ratio  0.22       -0.42       -0.14        1.00 -0.20   0.13  -0.07
data        -0.86       -0.49        0.66       -0.20  1.00   0.50  -0.01
people      -0.53       -0.35        0.30        0.13  0.50   1.00  -0.24
things       0.04       -0.04        0.09       -0.07 -0.01  -0.24   1.00
So this correction made little difference and seems unnecessary.
Of more interest are multiple regressions where we take the other job data into account. I used cognitive ability, people and things to predict each of the race%.
For Whites:
$coefs
        Beta   SE CI.lower CI.upper
iq      0.39 0.09     0.20     0.57
people -0.19 0.10    -0.37     0.00
things -0.09 0.08    -0.26     0.07

$meta
            N            R2       R2 adj. R2 10-fold cv
       124.00          0.26          0.24          0.19
Blacks:
$coefs
        Beta   SE CI.lower CI.upper
iq     -0.60 0.09    -0.77    -0.43
people  0.02 0.09    -0.16     0.19
things  0.12 0.07    -0.03     0.26

$meta
            N            R2       R2 adj. R2 10-fold cv
       124.00          0.38          0.36          0.34
Asians:
$coefs
       Beta   SE CI.lower CI.upper
iq     0.41 0.10     0.21     0.61
people 0.34 0.10     0.14     0.55
things 0.00 0.09    -0.17     0.17

$meta
            N            R2       R2 adj. R2 10-fold cv
       124.00          0.14          0.12          0.03
Notice the very low cross-validated R2. This is suspicious.
$coefs
        Beta   SE CI.lower CI.upper
iq     -0.54 0.09    -0.72    -0.36
people -0.05 0.10    -0.24     0.14
things -0.03 0.08    -0.19     0.13

$meta
            N            R2       R2 adj. R2 10-fold cv
       124.00          0.27          0.25          0.24
So, to recap, the standardized betas for the races with the other job predictors were:
White: .39
Black: -.60
Asian: .41
Other: -.54
Thus, the Asian result is not really an outlier once one takes into account their higher preference for working with people (people beta = .34). Note that White has a people beta at -.19, but it's not a reliable finding (cf. the confidence interval). Still, this means that Whites and Asians are pretty different on this preference, apparently.
Path models
Here one can stipulate the causal order of variables (kind of). I specified that the interests are caused by cognitive ability and that the race% are caused jointly by cognitive ability requirement and interests.
Here's the plots:
White:
[attachment=726]
Black:
[attachment=727]
Asian:
[attachment=728]
Other:
[attachment=729]
Looking at these we see that the results for the cognitive ability paths are consistent with the other results. Direct paths: .38, -.51, .23, -.51. For Asian and White there are opposite direction indirect paths thru the people interest as seen before.
--
Code for my replication is in the OSF folder "Emil_replication".
https://osf.io/pxmjc/files/
Bryan,
Quotes are yours unless otherwise specified.REPLY: We did not cross-check jobs, but instead relied on the Wonderlic’s ability and expertise at generating estimated IQs for different jobs. Also, we didn’t have older Wonderlic data, and suspect—as you point out—that matching jobs might be frustrating.
Older Wonderlic data is given by Gottfredson's classic 1997 paper. It was in my link.
Old Wonderlic data from Gottfredson.
I cannot get back to revising this til the weekend (Chuck: I was waiting to write the formal revision until more reviews were in).
To clarify just the above, are you asking me to use my fingernail on the chart to estimate the mean IQs for each job in the figure, and then attempt matching them to my data set of 100+ jobs, just to see what the correlation might be?
I see also the figure says "reprinted by permission of the publisher".
I was waiting to write the formal revision until more reviews were in
Take your time.
[A]re you asking me to use my fingernail on the chart to estimate the mean IQs for each job in the figure, and then attempt matching them to my data set of 100+ jobs...
This image crossed my mind, too.
Bryan,
I have some suggestions for a possible future paper, which could build off of this and be published in another journal.
(1) Approach this from the reverse direction and try to explain the employment differentials e.g., Asian/White using cognitive complexity and work-type orientation. That would involve just a few extra computations.
(2) There is a table, "Median usual weekly earnings of full-time wage and salary workers by occupation". Spearman's hypothesis might also explain pay inequality within job types. I recall reading -- Roth et al. (not sure which paper) -- that there are ability differences between groups within employment categories by cognitive complexity. Thus, one might expect cognitive complexity to explain variance in -- see: http://www.bls.gov/opub/ted/2011/ted_20110914.htm -- pay gaps.
(3) "Labor Force Characteristics by Race and Ethnicity" seems to be yearly; thus one could incorporate more years; for ease, one could write a pithy r-code and use a reader program to scan PDFs and spit the data into an excel file. Emil and I did this for an unpublishable analysis of National Merit/Scholarship data. One could probably use a modified version of that code.
(4) Sex data x occupations seems to be available online, though I don't know if the jobs match. See here: http://www.bls.gov/cps/cpsaat11.htm
"Employed persons by detailed occupation, sex, race, and Hispanic or Latino ethnicity". One could run a version of 1 for sex.
Just some thoughts.
Bryan,
Quotes are yours unless otherwise specified.REPLY: We did not cross-check jobs, but instead relied on the Wonderlic’s ability and expertise at generating estimated IQs for different jobs. Also, we didn’t have older Wonderlic data, and suspect—as you point out—that matching jobs might be frustrating.
Older Wonderlic data is given by Gottfredson's classic 1997 paper. It was in my link.
Old Wonderlic data from Gottfredson.
I cannot get back to revising this til the weekend (Chuck: I was waiting to write the formal revision until more reviews were in).
To clarify just the above, are you asking me to use my fingernail on the chart to estimate the mean IQs for each job in the figure, and then attempt matching them to my data set of 100+ jobs, just to see what the correlation might be?
I see also the figure says "reprinted by permission of the publisher".
Bryan,
Yes, that's the idea. It would be another validity check of your mean IQs by job. Of course, you may find that the jobs do not match very well and so this test is not possible. Gottfredson's list has a lot fewer jobs than your list, I think.
Due to the litigious nature of the US, many people ask for permission where none is needed. Reprinting a figure is clearly fair use.
I was waiting to write the formal revision until more reviews were in
Take your time.[A]re you asking me to use my fingernail on the chart to estimate the mean IQs for each job in the figure, and then attempt matching them to my data set of 100+ jobs...
This image crossed my mind, too.
I guess my problem is I don't see the value of finger-nailing Wonderlic's 1992 IQ scores by job to see what they correlate with Wonderlic's 2002 IQ scores by job.
Bryan,
I have some suggestions for a possible future paper, which could build off of this and be published in another journal.
(1) Approach this from the reverse direction and try to explain the employment differentials e.g., Asian/White using cognitive complexity and work-type orientation. That would involve just a few extra computations.
(2) There is a table, "Median usual weekly earnings of full-time wage and salary workers by occupation". Spearman's hypothesis might also explain pay inequality within job types. I recall reading -- Roth et al. (not sure which paper) -- that there are ability differences between groups within employment categories by cognitive complexity. Thus, one might expect cognitive complexity to explain variance in -- see: http://www.bls.gov/opub/ted/2011/ted_20110914.htm -- pay gaps.
(3) "Labor Force Characteristics by Race and Ethnicity" seems to be yearly; thus one could incorporate more years; for ease, one could write a pithy r-code and use a reader program to scan PDFs and spit the data into an excel file. Emil and I did this for an unpublishable analysis of National Merit/Scholarship data. One could probably use a modified version of that code.
(4) Sex data x occupations seems to be available online, though I don't know if the jobs match. See here: http://www.bls.gov/cps/cpsaat11.htm
"Employed persons by detailed occupation, sex, race, and Hispanic or Latino ethnicity". One could run a version of 1 for sex.
Just some thoughts.
Thanks Chuck,
I think there's a possible research stream in these and related data. I'm especially interested in potential sex differences by job IQ, and then in pay, but I haven't had time to do anything with it.
I realize there’s many additional analyses that could be conducted, together with extra columns of data that could be coded. I appreciate the additional analyses Emil provided here, but including them would make this a paper I didn’t intend to write (unless a change is required because my method was suspect). So, I’m trying to determine where compliance with a reviewer comment is necessary from a basic science point of view, versus cosmetic and/or an incremental change to the paper's value (at the expense of its brevity, which I see as a strength).
Could we perhaps summarize (beyond the revisions I already agreed to make in my Word-file replies) what I must do next? I’m trying to avoid both blatant disregard for the scientific method and being the archeologist studying his shovel.

© Copyright 2026 OpenPsych - All Rights Reserved