Title
Discounting IQ’s Relevance to Organizational Behavior: The “Somebody Else’s Problem” in Management Education
Authors
Bryan J. Pesta
Michael A. McDaniel
Peter J. Poznanski
Timothy DeGroot
Abstract
We hypothesize the existence of a “somebody else’s problem” in management education for the sub-discipline of organizational behavior (OB). The problem regards human intelligence, specifically, the general factor, g. Although g is arguably the most powerful variable in social science, OB educators largely ignore it. To demonstrate the former, we review a vast literature establishing g’s construct validity. To demonstrate the latter, we show that current OB textbooks place far less emphasis on g relative to a popular but less potent predictor of organizational success, emotional intelligence. We also show that when textbooks do reference g, it is often just to offer criticism. Misperceptions about empirical data on intelligence testing, denial that a general factor of intelligence exists, the reality of mean racial differences in mental ability, and the finding that genes play a non-trivial role in causing intelligence, seem to make OB’s treatment of this topic “somebody else’s problem.”
Files
https://www.dropbox.com/s/cicxskyfxvm4xto/OPD_Pesta_et_al.odt?dl=0
Back to [Archive] Post-review discussions
Title
Discounting IQ’s Relevance to Organizational Behavior: The “Somebody Else’s Problem” in Management Education
Authors
Bryan J. Pesta
Michael A. McDaniel
Peter J. Poznanski
Timothy DeGroot
Abstract
We hypothesize the existence of a “somebody else’s problem” in management education for the sub-discipline of organizational behavior (OB). The problem regards human intelligence, specifically, the general factor, g. Although g is arguably the most powerful variable in social science, OB educators largely ignore it. To demonstrate the former, we review a vast literature establishing g’s construct validity. To demonstrate the latter, we show that current OB textbooks place far less emphasis on g relative to a popular but less potent predictor of organizational success, emotional intelligence. We also show that when textbooks do reference g, it is often just to offer criticism. Misperceptions about empirical data on intelligence testing, denial that a general factor of intelligence exists, the reality of mean racial differences in mental ability, and the finding that genes play a non-trivial role in causing intelligence, seem to make OB’s treatment of this topic “somebody else’s problem.”
Files
https://www.dropbox.com/s/cicxskyfxvm4xto/OPD_Pesta_et_al.odt?dl=0
I didn't see a line where I should recommend one reviewer. I suggest James Thompson.
Bryan
You don't have to recommend one, but you can. I will email James for you.
Generally, this is a well written publication. I have no particular large complaints. Some comments below. Quotes are from the paper unless otherwise specified.
Careful with blending together IQ and g and general intelligence. Much confusion happens because of this. While IQ and extracted g usually correlate .99 or so, general mental ability is not the same as extracted g/IQ scores. To see this, think of IQ gains following retesting. Such gains can be substantial, especially if taking the same test twice within a short time-span (e.g. a day). However, everybody will (hopefully!) agree that such IQ gains do not really represent gains in general mental ability. Studies using Jensen's method (method of correlated vectors) show that such gains are hollow in terms of general mental ability, in that their MCV correlation is strongly negative, maybe -1 (after errors are removed).
This is why e.g. Gottfredson talks about IQs as vehicles of measurement. Gottfredson, L. S. (2002). Where and why g matters: Not a mystery. Human Performance, 15(1/2), 25-46.
http://emilkirkegaard.dk/en/?p=4029 papers about training gains in IQ
“misperceptions”, perhaps better to use “misconception”.
As for percent of variance claims, there are various ways to measure this. There is both percent of all variance, and also percent of common variance (i.e. excluding variance specific to each subtest). I think the 50% value comes from the common variance data. I have often found that g typically explains about 30-40% of all variance.
It also depends on factor methodology. PCA gives higher numbers since it includes some error variance into the general factor. Hierarchical methods give lower results too.
There are other methods for measuring factor strength than variance percents, and they have their own problems.
I'm not aware of any meta-analysis of this question either, but it is possible to do so without having to dig up studies because Carroll's correlation matrices are publicly available. One would simply have to reanalyze all these using consistent methodology and calculate summary statistics.
Carroll's data
http://www.iapsych.com/wmfhcaarchive/map.htm
for factor strength methods, see
Revelle, W., & Wilt, J. (2013). The general factor of personality: A general critique. Journal of research in personality, 47(5), 493-504.
See also Dalliard's great paper on this topic of the 'statistical g factor myth': http://humanvarieties.org/2013/04/03/is-psychometric-g-a-myth/
I wouldn't say consensus, but perhaps large majority. Oddly, I don't think the two surveys of intelligence researchers (1978, 2013) included a question about this.
The number of narrow abilities is open-ended, at least according to Jensen 1998.
As for the second-stratum abilities, there is also disagreement. See e.g. Johnson, W., & Bouchard, T. J. (2005). The structure of human intelligence: It is verbal, perceptual, and image rotation (VPR), not fluid and crystallized. Intelligence, 33(4), 393-416.
But there is broad agreement about a hierarchical structure, no matter the details about the lower levels.
There is also the general socioeconomic factor, which I have published extensively on lately. I don't know if you are familiar with it, but basically anything good tends to covary with everything else good, at least at aggregate levels. I have found it at country-level, immigrant origin-level and state-level many times. It is quite similar to your well-being nexus.
Some key publications (mine)
http://openpsych.net/ODP/2014/10/crime-income-educational-attainment-and-employment-among-immigrant-groups-in-norway-and-finland/
http://openpsych.net/ODP/2014/09/the-international-general-socioeconomic-factor-factor-analyzing-international-rankings/
https://thewinnower.com/papers/the-s-factor-in-brazilian-states
These S factors of course are strongly related to cognitive scores.
You could cite some of the papers about the recent debate:
Dickens, W. T., & Flynn, J. R. (2006). Black Americans reduce the racial IQ gap evidence from standardization samples. Psychological Science, 17(10), 913-920.
Rushton, J. P., & Jensen, A. R. (2006). The totality of available evidence shows the race IQ gap still remains. Psychological Science, 17(10), 921-922.
Murray, C. (2007). The magnitude and components of change in the black–white IQ difference from 1920 to 1991: A birth cohort analysis of the Woodcock–Johnson standardizations. Intelligence, 35(4), 305-318.
There are some more.
I don't know about this double as g-loaded finding. I haven't seen any replications and I'm cautious about accepted findings from 1 old study (1975).
I found a study reporting a correlation matrix for forward and backwards digit span. Then I factor analyzed it. The loadings were .39 and .41, forwards/backwards. http://dx.doi.org/10.1016/j.intell.2004.07.007
R code:
In a Vietnamese study, subtest x age correlations were correlated with subtest g-loadings, and the age cors were about equal for forward and backward. http://emilkirkegaard.dk/en/?p=4612
This study found loadings of .64 and .63 forward/backward.
Ramsay, M. C., & Reynolds, C. R. (1995). Separate digits tests: A brief history, a literature review, and a reexamination of the factor structure of the Test of Memory and Learning (TOMAL). Neuropsychology Review, 5(3), 151-171.
I went thru another 30 or something correlation matrices in Carroll's data but did not see one with forward and backward separate. Perhaps if you look more (I looked all in the first two pages of studies). http://www.iapsych.com/wmfhcaarchive/wmfhcaindex.html
This is a more general pattern and has been called the Wilson effect. There's a meta-analysis:
Bergen, S. E., Gardner, C. O., & Kendler, K. S. (2007). Age-related changes in heritability of behavioral phenotypes over adolescence and young adulthood: a meta-analysis. Twin Research and Human Genetics, 10(03), 423-433.
Bouchard, T. J. (2013). The Wilson effect: the increase in heritability of IQ with age. Twin Research and Human Genetics, 16(05), 923-930.
Scholar does not only count academic literature. It is more inclusive.
See also:
Intelligence 34(5): Testing multiple intelligence theory
Visser, Beth A., Michael C. Ashton, and Philip A. Vernon. “Beyond< i> g</i>: Putting multiple intelligences theory to the test.” Intelligence 34.5 (2006): 487-502.
1. Beyond g Putting multiple intelligences theory to the test
Gardner, Howard. “On failing to grasp the core of MI theory: A response to Visser et al.” Intelligence 34.5 (2006): 503-505.
2. On failing to grasp the core of MI theory A response to Visser et al.
Visser, Beth A., Michael C. Ashton, and Philip A. Vernon. “< i> g</i> and the measurement of Multiple Intelligences: A response to Gardner.” Intelligence 34.5 (2006): 507-510.
3. g and the measurement of Multiple Intelligences A response to Gardner
Educational psychologist 41(4), the issue that is about multiple intelligence ‘theories’
Waterhouse, Lynn. “Multiple intelligences, the Mozart effect, and emotional intelligence: A critical review.” Educational Psychologist 41.4 (2006): 207-225.
Gardner, Howard, and Seana Moran. “The science of multiple intelligences theory: A response to Lynn Waterhouse.” Educational psychologist 41.4 (2006): 227-232.
Rauscher, Frances H., and Sean C. Hinton. “The Mozart effect: Music listening is not music instruction.” Educational Psychologist 41.4 (2006): 233-238.
Cherniss, Cary, et al. “Emotional intelligence: what does the research really indicate?.” Educational Psychologist 41.4 (2006): 239-245.
Waterhouse, Lynn. “Inadequate evidence for multiple intelligences, Mozart effect, and emotional intelligence theories.” Educational Psychologist 41.4 (2006): 247-255.
Alexander, Patricia A. “Evolution of a learning theory: A case study.” Educational Psychologist 41.4 (2006): 257-264.
Organizational behavior (OB) textbooks contain perhaps the most interdisciplinary content in all of social science. They include lecture material from psychology, sociology, anthropology, political science, and economics. We argue here, however, that OB textbooks tend to ignore what is possibly social science’s most powerful variable: IQ (i.e., the general factor, termed “g”). OB textbooks discount the general factor to the point that when discussing intelligence, they often either criticize g, relegate its status as secondary to that of specific mental abilities, or focus more attention on other types of “intelligence” (e.g., emotional intelligence) that possess less predictive validity.
Careful with blending together IQ and g and general intelligence. Much confusion happens because of this. While IQ and extracted g usually correlate .99 or so, general mental ability is not the same as extracted g/IQ scores. To see this, think of IQ gains following retesting. Such gains can be substantial, especially if taking the same test twice within a short time-span (e.g. a day). However, everybody will (hopefully!) agree that such IQ gains do not really represent gains in general mental ability. Studies using Jensen's method (method of correlated vectors) show that such gains are hollow in terms of general mental ability, in that their MCV correlation is strongly negative, maybe -1 (after errors are removed).
This is why e.g. Gottfredson talks about IQs as vehicles of measurement. Gottfredson, L. S. (2002). Where and why g matters: Not a mystery. Human Performance, 15(1/2), 25-46.
http://emilkirkegaard.dk/en/?p=4029 papers about training gains in IQ
“misperceptions”, perhaps better to use “misconception”.
Some (see, e.g., Gould 1996) believe that g is a statistical artifact, emerging from the arbitrary nature of factor analysis, and the intelligence researcher’s misguided attempts to interpret correlations among cognitive ability test scores. It is admittedly counterintuitive that single IQ scores meaningfully reflect the vast array of human mental ability. However, IQ test scores do this precisely because they measure the general factor. Although other specific types of intelligence exist, g accounts for roughly 50 percent of their variance (Jensen, 1998; McGrew, 2009). g then likely reflects the speed and efficiency with which brains process most any perceptual or cognitive information (Jensen, 2011).
As for percent of variance claims, there are various ways to measure this. There is both percent of all variance, and also percent of common variance (i.e. excluding variance specific to each subtest). I think the 50% value comes from the common variance data. I have often found that g typically explains about 30-40% of all variance.
It also depends on factor methodology. PCA gives higher numbers since it includes some error variance into the general factor. Hierarchical methods give lower results too.
There are other methods for measuring factor strength than variance percents, and they have their own problems.
I'm not aware of any meta-analysis of this question either, but it is possible to do so without having to dig up studies because Carroll's correlation matrices are publicly available. One would simply have to reanalyze all these using consistent methodology and calculate summary statistics.
Carroll's data
http://www.iapsych.com/wmfhcaarchive/map.htm
for factor strength methods, see
Revelle, W., & Wilt, J. (2013). The general factor of personality: A general critique. Journal of research in personality, 47(5), 493-504.
See also Dalliard's great paper on this topic of the 'statistical g factor myth': http://humanvarieties.org/2013/04/03/is-psychometric-g-a-myth/
Consensus now exists regarding the factorial structure of human mental abilities: The Cattell-Horn-Carroll (CHC) theory of intelligence (Carroll, 1993; McGrew, 2009). In the model, cognitive abilities form a three-stratum hierarchy. The apex contains a single general factor, g, which correlates strongly with all factors below it. The middle of the hierarchy consists of nine broad abilities (e.g., processing speed; short-term memory). Fully 80 narrow mental abilities (e.g., perceptual speed; word fluency) comprise the lowest stratum.
I wouldn't say consensus, but perhaps large majority. Oddly, I don't think the two surveys of intelligence researchers (1978, 2013) included a question about this.
The number of narrow abilities is open-ended, at least according to Jensen 1998.
As for the second-stratum abilities, there is also disagreement. See e.g. Johnson, W., & Bouchard, T. J. (2005). The structure of human intelligence: It is verbal, perceptual, and image rotation (VPR), not fluid and crystallized. Intelligence, 33(4), 393-416.
But there is broad agreement about a hierarchical structure, no matter the details about the lower levels.
Relationships between g and health are ubiquitous and striking. Arden et al. (2009) postulated the existence of a general fitness factor to explain links between these constructs. We suspect that Jensen’s (1998) g nexus, Pesta et al.’s (2010) well-being nexus, and Arden et al.’s (2009) general fitness factor are converging on the same constructs.
There is also the general socioeconomic factor, which I have published extensively on lately. I don't know if you are familiar with it, but basically anything good tends to covary with everything else good, at least at aggregate levels. I have found it at country-level, immigrant origin-level and state-level many times. It is quite similar to your well-being nexus.
Some key publications (mine)
http://openpsych.net/ODP/2014/10/crime-income-educational-attainment-and-employment-among-immigrant-groups-in-norway-and-finland/
http://openpsych.net/ODP/2014/09/the-international-general-socioeconomic-factor-factor-analyzing-international-rankings/
https://thewinnower.com/papers/the-s-factor-in-brazilian-states
These S factors of course are strongly related to cognitive scores.
Data on race and IQ go back to at least World War I (Jensen, 1998). This century, Roth, Bevier, Bobko, Switzer, and Tyler (2001) conducted a large-scale meta-analytic summary of these effects (N = 6,246,729 people). Black / White differences in mean IQ scores are quite large, although the distributions overlap considerably across groups. Overlapping distributions indicate that millions of minorities score higher on IQ tests relative to tens of millions of Whites, just in the USA. Nonetheless, many of the effect sizes exceed 1.0 (Roth et al., 2001). Finally, debate exists about whether these gaps have recently narrowed, but no one has yet determined the cause of race differences in intelligence, nor how to meaningfully reduce them.
You could cite some of the papers about the recent debate:
Dickens, W. T., & Flynn, J. R. (2006). Black Americans reduce the racial IQ gap evidence from standardization samples. Psychological Science, 17(10), 913-920.
Rushton, J. P., & Jensen, A. R. (2006). The totality of available evidence shows the race IQ gap still remains. Psychological Science, 17(10), 921-922.
Murray, C. (2007). The magnitude and components of change in the black–white IQ difference from 1920 to 1991: A birth cohort analysis of the Woodcock–Johnson standardizations. Intelligence, 35(4), 305-318.
There are some more.
The problem is that race differences covary strongly with how well a mental test measures g. The digit span task is a classic example. Here, the tester vocalizes a random number string (e.g., 5, 4, 7, 1, 9) at the rate of one number per second. The respondent then immediately attempts to recall each number in either forward (i.e., 5, 4, 7, 1, 9) or backward (i.e., 9, 1, 7, 4, 5) serial order. The backward version is roughly twice as g-loaded as the forward version, and it produces roughly twice as large a difference across racial groups (Jensen, & Figueroa, 1976).
I don't know about this double as g-loaded finding. I haven't seen any replications and I'm cautious about accepted findings from 1 old study (1975).
I found a study reporting a correlation matrix for forward and backwards digit span. Then I factor analyzed it. The loadings were .39 and .41, forwards/backwards. http://dx.doi.org/10.1016/j.intell.2004.07.007
R code:
library(pacman)
p_load(psych, lavaan)

cor.matrix = c(1, .20, .21, .35, .25,
               1,.72, .14, .17,
               1,.14, .09,
               1,.68,
               1)

cor.matrix = upper2full(cor.matrix)
colnames(cor.matrix) = rownames(cor.matrix) = c("Raven", "Vocab WAIS", "Vocab Shipley", "D. backwards", "D. forwards")
fa(cor.matrix)
In a Vietnamese study, subtest x age correlations were correlated with subtest g-loadings, and the age cors were about equal for forward and backward. http://emilkirkegaard.dk/en/?p=4612
This study found loadings of .64 and .63 forward/backward.
Ramsay, M. C., & Reynolds, C. R. (1995). Separate digits tests: A brief history, a literature review, and a reexamination of the factor structure of the Test of Memory and Learning (TOMAL). Neuropsychology Review, 5(3), 151-171.
I went thru another 30 or something correlation matrices in Carroll's data but did not see one with forward and backward separate. Perhaps if you look more (I looked all in the first two pages of studies). http://www.iapsych.com/wmfhcaarchive/wmfhcaindex.html
Bouchard (2004) offered a sound summary of the literature in this area. For young children, environmental factors (e.g., parenting philosophy, socioeconomic status) strongly influence individual differences in intelligence. Surprisingly, the effects of “shared environment” gradually drop to approximately zero as children mature into adulthood. Multiple lines of evidence confirm this conclusion, including studies using twins and siblings (raised in either the same or different environments) or adoptees. By the time people reach working age and organizational behaviors become salient, approximately 85% of the variance in IQ test scores is caused by genes.
This is a more general pattern and has been called the Wilson effect. There's a meta-analysis:
Bergen, S. E., Gardner, C. O., & Kendler, K. S. (2007). Age-related changes in heritability of behavioral phenotypes over adolescence and young adulthood: a meta-analysis. Twin Research and Human Genetics, 10(03), 423-433.
Bouchard, T. J. (2013). The Wilson effect: the increase in heritability of IQ with age. Twin Research and Human Genetics, 16(05), 923-930.
Conventional wisdom wrongly suggests that IQ tests reflect only narrow academic skills of no real-world import. Instead, the presumed existence of multiple intelligences captures the public’s fascination. Consider the popularity of Gardner’s (1983) theory of “multiple intelligences.” Via Google Scholar, Frames of Mind (Gardner, 1983), has been cited 20,694 times in just the academic literature.
Scholar does not only count academic literature. It is more inclusive.
Gardner hypothesized that unique, relatively uncorrelated, intelligences exist, and that they rival g in terms of importance. However, no one has produced data contradicting the “law” of positive manifold (for a review, see Wilson, 2012). Instead, scores on diverse sets of mental tests correlate positively.
See also:
Intelligence 34(5): Testing multiple intelligence theory
Visser, Beth A., Michael C. Ashton, and Philip A. Vernon. “Beyond< i> g</i>: Putting multiple intelligences theory to the test.” Intelligence 34.5 (2006): 487-502.
1. Beyond g Putting multiple intelligences theory to the test
Gardner, Howard. “On failing to grasp the core of MI theory: A response to Visser et al.” Intelligence 34.5 (2006): 503-505.
2. On failing to grasp the core of MI theory A response to Visser et al.
Visser, Beth A., Michael C. Ashton, and Philip A. Vernon. “< i> g</i> and the measurement of Multiple Intelligences: A response to Gardner.” Intelligence 34.5 (2006): 507-510.
3. g and the measurement of Multiple Intelligences A response to Gardner
Educational psychologist 41(4), the issue that is about multiple intelligence ‘theories’
Waterhouse, Lynn. “Multiple intelligences, the Mozart effect, and emotional intelligence: A critical review.” Educational Psychologist 41.4 (2006): 207-225.
Gardner, Howard, and Seana Moran. “The science of multiple intelligences theory: A response to Lynn Waterhouse.” Educational psychologist 41.4 (2006): 227-232.
Rauscher, Frances H., and Sean C. Hinton. “The Mozart effect: Music listening is not music instruction.” Educational Psychologist 41.4 (2006): 233-238.
Cherniss, Cary, et al. “Emotional intelligence: what does the research really indicate?.” Educational Psychologist 41.4 (2006): 239-245.
Waterhouse, Lynn. “Inadequate evidence for multiple intelligences, Mozart effect, and emotional intelligence theories.” Educational Psychologist 41.4 (2006): 247-255.
Alexander, Patricia A. “Evolution of a learning theory: A case study.” Educational Psychologist 41.4 (2006): 257-264.
This is a nice paper, but there are a couple of minor issues:
1) "The backward version is roughly twice as g-loaded as the forward version, and it produces roughly twice as large a difference across racial groups (Jensen, & Figueroa, 1976)."
That paper doesn't report g loadings for backward (BDS) and forward digit span (FDB). Rather, it reports correlations of BDS and FDS with full scale IQ (FSIQ), which is not exactly the same thing. The BDS-FSIQ correlation is about 25% (whites) or 50% (blacks) higher than the FDS-FSIQ correlation. The standandized black-white gap on BDS in this sample is more than 100% larger than the gap on FDS. The FDS-BDS discrepancy between whites and blacks is too large to be explained in terms of Spearman's hypothesis.
I don't think there's a single study where the g loading of BDS has been found to be anywhere near to being twice that of FDS. For example, on the DAS-II (data from Keith et al. 2010), the g loadings of FDS and BDS are 0.593 and 0.675, respectively.
While Spearman's hypothesis is strongly borne out by IQ data in general, I don't believe it can explain (most of) the FDS-BDS discrepancy. Blacks are relatively strong on FDS mainly because they are superior to whites on some narrow ability required in this test, not because FDS has a low g loading. See Jensen & Reynolds 1982 where it was shown that net of g, blacks were superior to whites on the memory factor. See also my analysis here.
The passage about digit span tests as an illustration of Spearman's hypothesis should be removed because it appears to be empirically wrong. Replace it with a more general description of Spearman's hypothesis and the data supporting it (e.g., Jensen's meta-analysis of 15 test batteries as reported in Jensen 1998).
2) "Also problematic is EQ’s construct validity, as some claim it may merely be a repackaged version of the Big Five personality traits (Conte, 2005; Robbins & Judge, 2015)."
MacCann et al. found that an emotional intelligence factor computed from the MSCEIT test had a g-loading of 0.80. This suggests that emotional intelligence, at least when measured with the MSCEIT, may derive its predictive validity from g rather than any emotional ability. This should be discussed alongside with the evidence that emotional intelligence may not be independent from traditional personality measures.
3) Explain how the five-star rating in the table is determined.
If these three issues are addressed adequately, I approve publication.
(Fixed formatting -Emil)
To Emil:
I’ll upload a revision that incorporates our comments below, but I’m waiting to see if anyone else is going to peer review this. This paper is aimed at non-experts, so we tried not to delve into peripheral or specific technical issues in our generic lit review. We wanted to give readers a basic sense of what we know about g based on decades of data. Admittedly, there are more issues and effects in field that we could have discussed, but again our goal was to dispel what we felt are the most persistent myths about g.
1. We agree. We think a simple fix is “IQ (i.e., tests used as proxies for measures of the general factor of intelligence, g).” We don’t really want to get into the Flynn effect or the specifics of extracting g scores from IQ scores.
2. We will change misperception to misconception.
3. We were careful to use the word “roughly” and took the 50% value from Jensen, 1998. The point we were trying to make is not to precisely pinpoint the number but to suggest that it’s quite large. We can omit mentioning a number entirely (e.g., “g accounts for a large percentage of their variance”) or keep “roughly 50%,” whichever is your preference. We didn’t really want to get into the statistics behind deriving g, given our target audience.
4. We will change the word consensus; and not assert a specific / fixed number of abilities (our intent was not to present a drawn out literature review, but just to emphasize the hierarchical structure).
5. We can incorporate the S factor and citations into this section.
6. We will add these citations. We worried that the paper was over-cited already—given how short it is—but again, adding more is fine.
7. The reviewer below also had an issue with this paragraph. We will delete it and just mention the problem is Spearman’s hypothesis, without providing the digit symbol example.
8. No problem incorporating the above into the revision.
9. Noted and will change the wording here.
10. We can incorporate some of all of these citations into the revision.
I’ll upload a revision that incorporates our comments below, but I’m waiting to see if anyone else is going to peer review this. This paper is aimed at non-experts, so we tried not to delve into peripheral or specific technical issues in our generic lit review. We wanted to give readers a basic sense of what we know about g based on decades of data. Admittedly, there are more issues and effects in field that we could have discussed, but again our goal was to dispel what we felt are the most persistent myths about g.
…Careful with blending together IQ and g and general intelligence. Much confusion happens because of this. While IQ and extracted g usually correlate .99 or so, general mental ability is not the same as extracted g/IQ scores. To see this, think of IQ gains following retesting. Such gains can be substantial, especially if taking the same test twice within a short time-span (e.g. a day). However, everybody will (hopefully!) agree that such IQ gains do not really represent gains in general mental ability. Studies using Jensen's method (method of correlated vectors) show that such gains are hollow in terms of general mental ability, in that their MCV correlation is strongly negative, maybe -1 (after errors are removed).
1. We agree. We think a simple fix is “IQ (i.e., tests used as proxies for measures of the general factor of intelligence, g).” We don’t really want to get into the Flynn effect or the specifics of extracting g scores from IQ scores.
2. We will change misperception to misconception.
g accounts for roughly 50 percent of their variance (Jensen, 1998; McGrew, 2009). g then likely reflects the speed and efficiency with which brains process most any perceptual or cognitive information (Jensen, 2011)…
As for percent of variance claims, there are various ways to measure this. There is both percent of all variance, and also percent of common variance (i.e. excluding variance specific to each subtest). I think the 50% value comes from the common variance data. I have often found that g typically explains about 30-40% of all variance.
It also depends on factor methodology. PCA gives higher numbers since it includes some error variance into the general factor. Hierarchical methods give lower results too.
There are other methods for measuring factor strength than variance percents, and they have their own problems.
I'm not aware of any meta-analysis of this question either, but it is possible to do so without having to dig up studies because Carroll's correlation matrices are publicly available. One would simply have to reanalyze all these using consistent methodology and calculate summary statistics…
3. We were careful to use the word “roughly” and took the 50% value from Jensen, 1998. The point we were trying to make is not to precisely pinpoint the number but to suggest that it’s quite large. We can omit mentioning a number entirely (e.g., “g accounts for a large percentage of their variance”) or keep “roughly 50%,” whichever is your preference. We didn’t really want to get into the statistics behind deriving g, given our target audience.
I wouldn't say consensus, but perhaps large majority. Oddly, I don't think the two surveys of intelligence researchers (1978, 2013) included a question about this.
The number of narrow abilities is open-ended, at least according to Jensen 1998.
As for the second-stratum abilities, there is also disagreement. See e.g. Johnson, W., & Bouchard, T. J. (2005). The structure of human intelligence: It is verbal, perceptual, and image rotation (VPR), not fluid and crystallized. Intelligence, 33(4), 393-416.
But there is broad agreement about a hierarchical structure, no matter the details about the lower levels.
4. We will change the word consensus; and not assert a specific / fixed number of abilities (our intent was not to present a drawn out literature review, but just to emphasize the hierarchical structure).
Relationships between g and health are ubiquitous and striking. Arden et al. (2009) postulated the existence of a general fitness factor to explain links between these constructs. We suspect that Jensen’s (1998) g nexus, Pesta et al.’s (2010) well-being nexus, and Arden et al.’s (2009) general fitness factor are converging on the same constructs…
There is also the general socioeconomic factor, which I have published extensively on lately. I don't know if you are familiar with it, but basically anything good tends to covary with everything else good, at least at aggregate levels. I have found it at country-level, immigrant origin-level and state-level many times. It is quite similar to your well-being nexus.
Some key publications (mine)
http://openpsych.net/ODP/2014/10/crime-income-educational-attainment-and-employment-among-immigrant-groups-in-norway-and-finland/
http://openpsych.net/ODP/2014/09/the-international-general-socioeconomic-factor-factor-analyzing-international-rankings/
https://thewinnower.com/papers/the-s-factor-in-brazilian-states
These S factors of course are strongly related to cognitive scores.
5. We can incorporate the S factor and citations into this section.
Data on race and IQ go back to at least World War I (Jensen, 1998). This century, Roth, Bevier, Bobko, Switzer, and Tyler (2001) conducted a large-scale meta-analytic summary of these effects (N = 6,246,729 people). Black / White differences in mean IQ scores are quite large, although the distributions overlap considerably across groups. Overlapping distributions indicate that millions of minorities score higher on IQ tests relative to tens of millions of Whites, just in the USA. Nonetheless, many of the effect sizes exceed 1.0 (Roth et al., 2001). Finally, debate exists about whether these gaps have recently narrowed, but no one has yet determined the cause of race differences in intelligence, nor how to meaningfully reduce them. …
You could cite some of the papers about the recent debate:
Dickens, W. T., & Flynn, J. R. (2006). Black Americans reduce the racial IQ gap evidence from standardization samples. Psychological Science, 17(10), 913-920.
Rushton, J. P., & Jensen, A. R. (2006). The totality of available evidence shows the race IQ gap still remains. Psychological Science, 17(10), 921-922.
Murray, C. (2007). The magnitude and components of change in the black–white IQ difference from 1920 to 1991: A birth cohort analysis of the Woodcock–Johnson standardizations. Intelligence, 35(4), 305-318.
There are some more.
6. We will add these citations. We worried that the paper was over-cited already—given how short it is—but again, adding more is fine.
The problem is that race differences covary strongly with how well a mental test measures g. The digit span task is a classic example. Here, the tester vocalizes a random number string (e.g., 5, 4, 7, 1, 9) at the rate of one number per second. The respondent then immediately attempts to recall each number in either forward (i.e., 5, 4, 7, 1, 9) or backward (i.e., 9, 1, 7, 4, 5) serial order. The backward version is roughly twice as g-loaded as the forward version, and it produces roughly twice as large a difference across racial groups (Jensen, & Figueroa, 1976).
7. The reviewer below also had an issue with this paragraph. We will delete it and just mention the problem is Spearman’s hypothesis, without providing the digit symbol example.
Bouchard (2004) offered a sound summary of the literature in this area. For young children, environmental factors (e.g., parenting philosophy, socioeconomic status) strongly influence individual differences in intelligence. Surprisingly, the effects of “shared environment” gradually drop to approximately zero as children mature into adulthood. Multiple lines of evidence confirm this conclusion, including studies using twins and siblings (raised in either the same or different environments) or adoptees. By the time people reach working age and organizational behaviors become salient, approximately 85% of the variance in IQ test scores is caused by genes.…
This is a more general pattern and has been called the Wilson effect. There's a meta-analysis:
Bergen, S. E., Gardner, C. O., & Kendler, K. S. (2007). Age-related changes in heritability of behavioral phenotypes over adolescence and young adulthood: a meta-analysis. Twin Research and Human Genetics, 10(03), 423-433.
Bouchard, T. J. (2013). The Wilson effect: the increase in heritability of IQ with age. Twin Research and Human Genetics, 16(05), 923-930.
8. No problem incorporating the above into the revision.
Conventional wisdom wrongly suggests that IQ tests reflect only narrow academic skills of no real-world import. Instead, the presumed existence of multiple intelligences captures the public’s fascination. Consider the popularity of Gardner’s (1983) theory of “multiple intelligences.” Via Google Scholar, Frames of Mind (Gardner, 1983), has been cited 20,694 times in just the academic literature…
Scholar does not only count academic literature. It is more inclusive.
9. Noted and will change the wording here.
Gardner hypothesized that unique, relatively uncorrelated, intelligences exist, and that they rival g in terms of importance. However, no one has produced data contradicting the “law” of positive manifold (for a review, see Wilson, 2012). Instead, scores on diverse sets of mental tests correlate positively….
See also:
Intelligence 34(5): Testing multiple intelligence theory
Visser, Beth A., Michael C. Ashton, and Philip A. Vernon. “Beyond< i> g</i>: Putting multiple intelligences theory to the test.” Intelligence 34.5 (2006): 487-502.
1. Beyond g Putting multiple intelligences theory to the test
Gardner, Howard. “On failing to grasp the core of MI theory: A response to Visser et al.” Intelligence 34.5 (2006): 503-505.
2. On failing to grasp the core of MI theory A response to Visser et al.
Visser, Beth A., Michael C. Ashton, and Philip A. Vernon. “< i> g</i> and the measurement of Multiple Intelligences: A response to Gardner.” Intelligence 34.5 (2006): 507-510.
3. g and the measurement of Multiple Intelligences A response to Gardner
Educational psychologist 41(4), the issue that is about multiple intelligence ‘theories’
Waterhouse, Lynn. “Multiple intelligences, the Mozart effect, and emotional intelligence: A critical review.” Educational Psychologist 41.4 (2006): 207-225.
Gardner, Howard, and Seana Moran. “The science of multiple intelligences theory: A response to Lynn Waterhouse.” Educational psychologist 41.4 (2006): 227-232.
Rauscher, Frances H., and Sean C. Hinton. “The Mozart effect: Music listening is not music instruction.” Educational Psychologist 41.4 (2006): 233-238.
Cherniss, Cary, et al. “Emotional intelligence: what does the research really indicate?.” Educational Psychologist 41.4 (2006): 239-245.
Waterhouse, Lynn. “Inadequate evidence for multiple intelligences, Mozart effect, and emotional intelligence theories.” Educational Psychologist 41.4 (2006): 247-255.
Alexander, Patricia A. “Evolution of a learning theory: A case study.” Educational Psychologist 41.4 (2006): 257-264.
10. We can incorporate some of all of these citations into the revision.
Bryan,
I see the point with the target audience.
1) This is fine with me.
2) No requirement from me. Use the word you think best.
3) I prefer the vaguer phrasing, but no requirement.
4) Fine.
5) You don't have to. I would not require authors that they cite my own papers. That would be unethical.
6) Cite them if you want, or don't. Your call.
7) Fine.
8) Fine.
9) Fine.
10) No requirement. Cite which you think is relevant.
--
Regarding EQ issue raised by Dalliard above, it is somewhat complicated. There are a number of EQ tests. Some of them are ability related and thus related to GCA, while the others are personality related, but both are called measurements of EQ. Very confusing.
Some time ago I read a bunch of review articles about this. One of them was this: http://www.jstor.org/discover/10.2307/20447228?uid=3738032&uid=2&uid=4&sid=21106337968831
This is a nice paper, but there are a couple of minor issues:
<b>1) "The backward version is roughly twice as g-loaded as the forward version, and it produces roughly twice as large a difference across racial groups (Jensen, & Figueroa, 1976)."</b>
That <a href="http://arthurjensen.net/wp-content/uploads/2014/06/Forward-and-Backward-Digit-Span-Interaction-with-Race-and-IQ-Predictions-from-Jensens-Theory-1975-by-Arthur-Robert-Jensen-Richard-A.-Figueroa.pdf">paper</a>; doesn't report g loadings for backward (BDS) and forward digit span (FDB). Rather, it reports correlations of BDS and FDS with full scale IQ (FSIQ), which is not exactly the same thing. The BDS-FSIQ correlation is about 25% (whites) or 50% (blacks) higher than the FDS-FSIQ correlation. The standandized black-white gap on BDS in this sample is more than 100% larger than the gap on FDS. The FDS-BDS discrepancy between whites and blacks is too large to be explained in terms of Spearman's hypothesis.
I don't think there's a single study where the g loading of BDS has been found to be anywhere near to being twice that of FDS. For example, on the <a href="https://humanvarietiesdotorg.files.wordpress.com/2013/12/das-ii-g-loadings.png">DAS-II</a>; (data from <a href="http://onlinelibrary.wiley.com/doi/10.1002/pits.20498/abstract">Keith et al. 2010</a>), the g loadings of FDS and BDS are 0.593 and 0.675, respectively.
While Spearman's hypothesis is strongly borne out by IQ data in general, I don't believe it can explain (most of) the FDS-BDS discrepancy. Blacks are relatively strong on FDS mainly because they are superior to whites on some narrow ability required in this test, not because FDS has a low g loading. See <a href="http://arthurjensen.net/wp-content/uploads/2014/06/Race-Social-Class-and-Ability-Patterns-on-the-WISC-R-1982-by-Arthur-Robert-Jensen-Cecil-Randy-Reynolds.pdf">Jensen & Reynolds 1982</a> where it was shown that net of g, blacks were superior to whites on the memory factor. See also my analysis <a href="http://humanvarieties.org/2013/12/21/racial-differences-on-digit-span-tests/">here</a>;.
The passage about digit span tests as an illustration of Spearman's hypothesis should be removed because it appears to be empirically wrong. Replace it with a more general description of Spearman's hypothesis and the data supporting it (e.g., Jensen's meta-analysis of 15 test batteries as reported in Jensen 1998).
1. Agree and consistent with Emil's comments on this, we will remove mention of digit span in the revision.
<b>2) "Also problematic is EQ’s construct validity, as some claim it may merely be a repackaged version of the Big Five personality traits (Conte, 2005; Robbins & Judge, 2015)."</b>
<a href="http://psycnet.apa.org/journals/emo/14/2/358/">MacCann et al.</a> found that an emotional intelligence factor computed from the MSCEIT test had a g-loading of 0.80. This suggests that emotional intelligence, at least when measured with the MSCEIT, may derive its predictive validity from g rather than any emotional ability. This should be discussed alongside with the evidence that emotional intelligence may not be independent from traditional personality measures.
2. If you accept our "target audience" explanation above, we didn't want to get into the side issue of whether IQ and EQ overlap. Instead, we hoped to contrast EQ's popularity (but relative lack of validity) with IQs in management education.
<b>3) Explain how the five-star rating in the table is determined.</b>
If these three issues are addressed adequately, I approve publication.
3. As mentioned in the paper (p 12), the ratings were purely subjective based on the authors' impressions of how well the text covered g.
Here is the revision.
Quick note: The original was roughly 12 pages of text and 6 pages of references. We decided not to add many of the optional/suggested references in the reviews above. We did add mention of the S factor.
Thanks!
Bryan
https://www.dropbox.com/s/yozzdljqus8u2id/OPD_Pesta_et_al_v2.odt?dl=0
Quick note: The original was roughly 12 pages of text and 6 pages of references. We decided not to add many of the optional/suggested references in the reviews above. We did add mention of the S factor.
Thanks!
Bryan
https://www.dropbox.com/s/yozzdljqus8u2id/OPD_Pesta_et_al_v2.odt?dl=0
Most problems I mentioned before have been fixed as far as I can see.
Redundant reference
On my skimming I found an additional problem: the following reference is now redundant. It was cited before but you forgot to remove it from the reference section. Perhaps it is a good idea to go thru the references to make sure there are no more unnecessary ones.
Jensen, A., & Figueroa, R.A. (1976). Forward and backward digit span interaction with race and IQ: predictions from Jensen's theory. Journal of Educational Psychology, 67(6): 882-93.
Table 1
I looked at the data table at the end. Maybe there is something I don't understand, but I don't see how the total for George (et al) can be greater than the sum of accurate and critical paragraphs. Sometimes the "total" is smaller than the sum, but I take it that that is because some paragraphs contain more accurate and critical parts (?).
Inter-rater reliability
You mention at some point the inter-rater reliability of .86. However, I do not see which data this value is calculated from. This journal has a mandatory open data policy, so any data used for this study must be published.
The actual paragraphs of text from the text books, were they saved? At least the exact text locations must have been saved somewhere. They should be found in the supplementary material so that anyone wishing to reproduce the authors' judgment calls can do so.
It is within copyright law to publish short text excerpts for the purpose of criticism etc (fair use).
Statistical analyses
I do not see any mention of which statistical software was used to do the analyses. Is there a code-file used? If they were made by point-and-click software (e.g. SPSS), can the authors upload the output file so that others may verify that the reported results are correct from the output file?
It would be better if the authors could upload the source code file(s) (if any) and data files in a folder, so that anyone else may download the material and re-run all analyses with identical results. I recommend using the Open Science Framework for this. In order for science to be reproducible, a bare minimum step is that researchers with access to the same data should get the same results from running the same analyses. This has been called computational reproducibility, to distinguish it from empirical reproducibility (i.e. the results replicate when a new sample is gathered). http://edge.org/annual-question/2014/response/25340
I contacted James Thompson to hear if he wants to review, but have not heard from him yet. Perhaps he was busy organizing the London Conference of Intelligence. I will try again.
Most problems I mentioned before have been fixed as far as I can see.
Redundant reference
On my skimming I found an additional problem: the following reference is now redundant. It was cited before but you forgot to remove it from the reference section. Perhaps it is a good idea to go thru the references to make sure there are no more unnecessary ones.
Jensen, A., & Figueroa, R.A. (1976). Forward and backward digit span interaction with race and IQ: predictions from Jensen's theory. Journal of Educational Psychology, 67(6): 882-93.
Table 1
I looked at the data table at the end. Maybe there is something I don't understand, but I don't see how the total for George (et al) can be greater than the sum of accurate and critical paragraphs. Sometimes the "total" is smaller than the sum, but I take it that that is because some paragraphs contain more accurate and critical parts (?).
Inter-rater reliability
You mention at some point the inter-rater reliability of .86. However, I do not see which data this value is calculated from. This journal has a mandatory open data policy, so any data used for this study must be published.
The actual paragraphs of text from the text books, were they saved? At least the exact text locations must have been saved somewhere. They should be found in the supplementary material so that anyone wishing to reproduce the authors' judgment calls can do so.
It is within copyright law to publish short text excerpts for the purpose of criticism etc (fair use).
Statistical analyses
I do not see any mention of which statistical software was used to do the analyses. Is there a code-file used? If they were made by point-and-click software (e.g. SPSS), can the authors upload the output file so that others may verify that the reported results are correct from the output file?
It would be better if the authors could upload the source code file(s) (if any) and data files in a folder, so that anyone else may download the material and re-run all analyses with identical results. I recommend using the Open Science Framework for this. In order for science to be reproducible, a bare minimum step is that researchers with access to the same data should get the same results from running the same analyses. This has been called computational reproducibility, to distinguish it from empirical reproducibility (i.e. the results replicate when a new sample is gathered). http://edge.org/annual-question/2014/response/25340
I contacted James Thompson to hear if he wants to review, but have not heard from him yet. Perhaps he was busy organizing the London Conference of Intelligence. I will try again.
I fixed the references-- thanks for catching that.
Regarding the table, accuracy and criticality are independent. So, any paragraph can be accurate but critical, or vice versa. For example, George et al. had 4 paragraphs on IQ. Two of these four were accurate on IQ. Independently, one of these four was critical of IQ.
I have uploaded the data and attach it here. It shows each paragraph and gives page numbers. It also has the data we used to calculate reliability.
Note, I did the chi-squares by hand (they are easy to do), so I have no code to upload for these. All the data needed to conduct them, however, is in the table.
I'm gonna post the links in a new / fresh reply, which will contain the newest version of the paper, and the paragraph coding data.
Thanks!
BP
Bryan et al,
Re. count for George
I see. I had misunderstood. So for George, there are a total of 4 paragraphs, 2 of which were accurate and 1 which was critical, and 1-2 which were neither. I had failed to consider the option that paragraphs could be neither.
i.e. vs. e.g.
I think you meant "e.g." here, not "i.e.". "e.g." (exempli gratia) means for instance/example, whereas "i.e." (id est) means that is.
Analytic replication
I looked at the data, but could not figure out where the numbers in cols I and J came from, so I decided to use the data in cols B-E.
I successfully recreated Table 1 from the original data. Except for the data about the bonus material, which I don't see in the data file (?).
Statistical tests in detail
I found 4 tests in the paper all of which are chi square tests. I used this R function.
1. "Nonetheless, when the authors of our nine, sampled textbooks referenced “intelligence,” they devoted nearly twice as many paragraphs to EQ (63) relative to IQ (35), Ӽ2 (1) = 8.00, p = .005."
I guess the null hypothesis is that the proportion is .5 out of the 63+35 mentions. It looks like you did not use Yates correction. I could not immediately find out whether one should or should not use this correction. http://stats.stackexchange.com/questions/4569/yates-continuity-correction-for-2-x-2-contingency-tables
My result:
Exact match.
2. "Likewise, the number of bonus-content items devoted to EQ (11) was over three times that devoted to IQ (3), Ӽ2 (1) = 4.57, p = .0325."
Same test as above. I do not see the bonus data in the data file. But manually entering the data gives:
Exact match.
3. "Coverage of EQ was also considerably more accurate (98%, relative to 71% for IQ), Ӽ2 (1) = 16.4, p = .0001."
This looks like a two sample test of equal proportions.
Exact match.
4. "We found only one example of an inaccurate claim about EQ (i.e., Hellriegel & Slocum, 2011, although the authors did provide citations supporting their claim). Critical coverage of IQ (46%) was far more frequent relative to that for EQ (13%), Ӽ2 (1) = 13.3, p = .0003."
Same test as above.
Exact match.
Everything replicated for me, although it took me some time to tidy the data up again. My code and data file are attached to this post if anyone else is curious.
Re. count for George
I see. I had misunderstood. So for George, there are a total of 4 paragraphs, 2 of which were accurate and 1 which was critical, and 1-2 which were neither. I had failed to consider the option that paragraphs could be neither.
i.e. vs. e.g.
We then conducted searches in these books looking for coverage of either “IQ” (i.e., specific mention of g), or “EQ” as a comparison group.
I think you meant "e.g." here, not "i.e.". "e.g." (exempli gratia) means for instance/example, whereas "i.e." (id est) means that is.
Analytic replication
I looked at the data, but could not figure out where the numbers in cols I and J came from, so I decided to use the data in cols B-E.
I successfully recreated Table 1 from the original data. Except for the data about the bonus material, which I don't see in the data file (?).
Statistical tests in detail
I found 4 tests in the paper all of which are chi square tests. I used this R function.
1. "Nonetheless, when the authors of our nine, sampled textbooks referenced “intelligence,” they devoted nearly twice as many paragraphs to EQ (63) relative to IQ (35), Ӽ2 (1) = 8.00, p = .005."
I guess the null hypothesis is that the proportion is .5 out of the 63+35 mentions. It looks like you did not use Yates correction. I could not immediately find out whether one should or should not use this correction. http://stats.stackexchange.com/questions/4569/yates-continuity-correction-for-2-x-2-contingency-tables
My result:
1-sample proportions test without continuity correction

data:  totals.sum[4] out of totals.sum[1] + totals.sum[4], null probability 0.5
X-squared = 8, df = 1, p-value = 0.004678
alternative hypothesis: true p is not equal to 0.5
95 percent confidence interval:
 0.5442525 0.7306847
sample estimates:
        p
0.6428571
Exact match.
2. "Likewise, the number of bonus-content items devoted to EQ (11) was over three times that devoted to IQ (3), Ӽ2 (1) = 4.57, p = .0325."
Same test as above. I do not see the bonus data in the data file. But manually entering the data gives:
1-sample proportions test without continuity correction

data:  11 out of (11 + 3), null probability 0.5
X-squared = 4.5714, df = 1, p-value = 0.03251
alternative hypothesis: true p is not equal to 0.5
95 percent confidence interval:
 0.5241077 0.9242861
sample estimates:
        p
0.7857143
Exact match.
3. "Coverage of EQ was also considerably more accurate (98%, relative to 71% for IQ), Ӽ2 (1) = 16.4, p = .0001."
This looks like a two sample test of equal proportions.
2-sample test for equality of proportions without continuity correction

data:  c(totals.sum[2], totals.sum[5]) out of c(totals.sum[1], totals.sum[4])
X-squared = 16.4414, df = 1, p-value = 5.018e-05
alternative hypothesis: two.sided
95 percent confidence interval:
 -0.4226538 -0.1170287
sample estimates:
   prop 1    prop 2
0.7142857 0.9841270
Exact match.
4. "We found only one example of an inaccurate claim about EQ (i.e., Hellriegel & Slocum, 2011, although the authors did provide citations supporting their claim). Critical coverage of IQ (46%) was far more frequent relative to that for EQ (13%), Ӽ2 (1) = 13.3, p = .0003."
Same test as above.
2-sample test for equality of proportions without continuity correction

data:  c(totals.sum[3], totals.sum[6]) out of c(totals.sum[1], totals.sum[4])
X-squared = 13.2629, df = 1, p-value = 0.0002707
alternative hypothesis: two.sided
95 percent confidence interval:
 0.1457757 0.5145417
sample estimates:
   prop 1    prop 2
0.4571429 0.1269841
Exact match.
Everything replicated for me, although it took me some time to tidy the data up again. My code and data file are attached to this post if anyone else is curious.
Thanks for checking our stats.
Because there were so few bonus content items, I didn't create numerical columns for them, but mentioned them in the "notes" column.
Also, I think we intended to use "i.e." versus "e.g." as we wanted to distinguish between mentions of multiple intelligences, for example, versus mention of the general factor.
If you want me to clarify this in a revision, let me know.
Thanks to all who commented here; what's the next step?
Bryan
Bryan et al,
Re. count for George
I see. I had misunderstood. So for George, there are a total of 4 paragraphs, 2 of which were accurate and 1 which was critical, and 1-2 which were neither. I had failed to consider the option that paragraphs could be neither.
i.e. vs. e.g.We then conducted searches in these books looking for coverage of either “IQ” (i.e., specific mention of g), or “EQ” as a comparison group.
I think you meant "e.g." here, not "i.e.". "e.g." (exempli gratia) means for instance/example, whereas "i.e." (id est) means that is.
Analytic replication
I looked at the data, but could not figure out where the numbers in cols I and J came from, so I decided to use the data in cols B-E.
I successfully recreated Table 1 from the original data. Except for the data about the bonus material, which I don't see in the data file (?).
Statistical tests in detail
I found 4 tests in the paper all of which are chi square tests. I used this R function.
1. "Nonetheless, when the authors of our nine, sampled textbooks referenced “intelligence,” they devoted nearly twice as many paragraphs to EQ (63) relative to IQ (35), Ӽ2 (1) = 8.00, p = .005."
I guess the null hypothesis is that the proportion is .5 out of the 63+35 mentions. It looks like you did not use Yates correction. I could not immediately find out whether one should or should not use this correction. http://stats.stackexchange.com/questions/4569/yates-continuity-correction-for-2-x-2-contingency-tables
My result:1-sample proportions test without continuity correction
data: totals.sum[4] out of totals.sum[1] + totals.sum[4], null probability 0.5
X-squared = 8, df = 1, p-value = 0.004678
alternative hypothesis: true p is not equal to 0.5
95 percent confidence interval:
0.5442525 0.7306847
sample estimates:
p
0.6428571
Exact match.
2. "Likewise, the number of bonus-content items devoted to EQ (11) was over three times that devoted to IQ (3), Ӽ2 (1) = 4.57, p = .0325."
Same test as above. I do not see the bonus data in the data file. But manually entering the data gives:1-sample proportions test without continuity correction
data: 11 out of (11 + 3), null probability 0.5
X-squared = 4.5714, df = 1, p-value = 0.03251
alternative hypothesis: true p is not equal to 0.5
95 percent confidence interval:
0.5241077 0.9242861
sample estimates:
p
0.7857143
Exact match.
3. "Coverage of EQ was also considerably more accurate (98%, relative to 71% for IQ), Ӽ2 (1) = 16.4, p = .0001."
This looks like a two sample test of equal proportions.2-sample test for equality of proportions without continuity correction
data: c(totals.sum[2], totals.sum[5]) out of c(totals.sum[1], totals.sum[4])
X-squared = 16.4414, df = 1, p-value = 5.018e-05
alternative hypothesis: two.sided
95 percent confidence interval:
-0.4226538 -0.1170287
sample estimates:
prop 1 prop 2
0.7142857 0.9841270
Exact match.
4. "We found only one example of an inaccurate claim about EQ (i.e., Hellriegel & Slocum, 2011, although the authors did provide citations supporting their claim). Critical coverage of IQ (46%) was far more frequent relative to that for EQ (13%), Ӽ2 (1) = 13.3, p = .0003."
Same test as above.2-sample test for equality of proportions without continuity correction
data: c(totals.sum[3], totals.sum[6]) out of c(totals.sum[1], totals.sum[4])
X-squared = 13.2629, df = 1, p-value = 0.0002707
alternative hypothesis: two.sided
95 percent confidence interval:
0.1457757 0.5145417
sample estimates:
prop 1 prop 2
0.4571429 0.1269841
Exact match.
Everything replicated for me, although it took me some time to tidy the data up again. My code and data file are attached to this post if anyone else is curious.
I have no more comments. I approve.
---
To get published, you need to get 3 approvals. You have 1 now, Dalliard will probably approve as well when he reads the revision. I have emailed James Thompson again, but have yet to hear back from him. If he does not want to review, then one of the other reviewers will do so (Meisenberg, Rindermann, Piffer, Meng Hu, or Fuerst).
Title
Discounting IQ’s Relevance to Organizational Behavior: The “Somebody Else’s Problem” in Management Education
I apologize for not commenting earlier.
Generally, in analyzing textbook presentations, the article makes an important contribution. Such studies are not uncommon in other fields (e.g., the treatment of race in medical textbooks); they give insight into what students are being taught and, to a lesser extent, the general opinion in the field. Jensen in Miele (2002) expressed the view that most discussions of intelligence in psych textbooks are either error filled or misleading. Unfortunately, as far as I am aware, no published research has formally investigated the matter. One wonders if intelligence is "someone else's problem" across psychology.
Regarding the general topic, there are three distinct issues. They are:
(a) Whether intelligence as a construct in under-researched in IO. This was discussed in a focus article by Scherbaum et al. (2012a) and commentary thereon.
Hanges et al. (2012b) concluded:
Both we and the majority of the commentaries clearly agree that intelligence should be a hotter topic than it currently is in the I–O journals. What does the limited publication of this type of research say about our field and its contribution toward understanding one of our most important constructs?
(b) Whether intelligence as an assessment is being under-employed by practitioners.
(c) Whether intelligence as a concept is not well being discussed in classes and in text books.
Your concern is, of course, (c). It would be interesting to know how (c) relates to (a) and (b), but I appreciate that that question falls outside of the scope of the paper. In general, I feel that this is a worthwhile paper which deserves publication.
I have a few quibbles and comments, however.
(P1) The discussion of FSIQ (a measure/manifest variable), g (a construct/latent variable), and intelligence (a concept which, in IO, either refers to stratum III in the hierarchy of cognitive abilities or to cognitive abilities in general) is less than perfectly clear. This is perhaps unavoidable given the condensed discussion.
This issue does not have bearing on the main point of the paper since the concern is whether FSIQ/GMA/GCA/g is given its due relative to other constructs. I just make note of the matter. I can discuss specific statements and transitions that I found to be less than crystal clear, if the author wishes. To restate, I am just offering my impression here, not requesting any changes.
(P2) The authors state:
Agreement now exists regarding the factorial structure of human mental abilities: The Cattell-Horn-Carroll (CHC) theory of intelligence (Carroll, 1993; McGrew, 2009).
I am not aware of a survey which shows this. I would rephrase the sentence along the lines of Lievens and Reeve (2012):
Most experts today accept some form of a hierarchal model, with a single general cognitive ability factor at the apex (referred to as ‘‘g’’ or ‘‘general mental ability’’) in large part due to the exhaustive work of John Carroll (1993).
This is a safer statement since there are multiple models in which g is at the apex e.g., VPR and it is seemingly not established that "most" agree with the CHC one.
(P3) The authors state:
Consider the following three quotations, each from a different OB textbook:
--Thus, managers must decide which mental abilities are required to successfully perform each job. For example, a language interpreter…would especially need language fluency (Gibson, et al., 2012, p. 90).
--Different jobs require various blends of these [mental] abilities. As some obvious examples, writers have to be adept at word fluency, statisticians have to be good at numerical ability and numerical reasoning, and architects have to be skilled at spatial visualization (Greenberg, 2013, p. 131)."
Though misleading, I am not sure that these first two statements are in fact incorrect. Imagine that I stated, "Above and beyond g, managers must decide which specific mental abilities are required to successfully perform each job." Would you say that this was incorrect, given that specific abilities do contribute some above and beyond general ability? If not then (1) (as quoted) is not. The same can be said for (2). (I do not have the full quotes, of course.) I agree that the third statement is incorrect because of the condition "as long as". Perhaps you can find more clearly erroneous statements.
(P4) You do not mention if the textbooks are at the undergraduate or graduate level. If the concern is with how IO practitioners -- who would have graduate degrees -- view IQ, this distinction is relevant. Please clarify.
(P5) Regarding the analysis, could you give a couple of examples of paragraphs/excerpts at least in the supplementary/excel file?
e.g., example excerpt -- reason coded thusly.
This gives readers/researchers a better sense of how you grade the paragraphs and what you deem to be accurate/critical, etc. This is important as perspectives may differ. For example, I would not have considered statements (1-2) in (P3) strictly to be inaccurate (as opposed to being incomplete).
Please address P2, P3, P4, P5. I have no other comments. Thank you for your submission.
--John
References:
Hanges, P. J., Scherbaum, C. A., Goldstein, H. W., Ryan, R., & Yusko, K. P. (2012). I–O Psychology and Intelligence: A Starting Point Established.Industrial and Organizational Psychology, 5(2), 189-195.
Lievens, F., & Reeve, C. L. (2012). Where I–O psychology should really (re) start its investigation of intelligence constructs and their measurement.Industrial and Organizational Psychology, 5(2), 153-158.
Miele, F. (2002). Intelligence, race, and genetics: Conversations with Arthur R. Jensen. Westview Press.
Scherbaum, C. A., Goldstein, H. W., Yusko, K. P., Ryan, R., & Hanges, P. J. (2012a). Intelligence 2.0: Reestablishing a research program on g in I–O psychology. Industrial and Organizational Psychology, 5(2), 128-148.
Title
Discounting IQ’s Relevance to Organizational Behavior: The “Somebody Else’s Problem” in Management Education
I apologize for not commenting earlier.
Generally, in analyzing textbook presentations, the article makes an important contribution. Such studies are not uncommon in other fields (e.g., the treatment of race in medical textbooks); they give insight into what students are being taught and, to a lesser extent, the general opinion in the field. Jensen in Miele (2002) expressed the view that most discussions of intelligence in psych textbooks are either error filled or misleading. Unfortunately, as far as I am aware, no published research has formally investigated the matter. One wonders if intelligence is "someone else's problem" across psychology.
Regarding the general topic, there are three distinct issues. They are:
(a) Whether intelligence as a construct in under-researched in IO. This was discussed in a focus article by Scherbaum et al. (2012a) and commentary thereon.
Hanges et al. (2012b) concluded:Both we and the majority of the commentaries clearly agree that intelligence should be a hotter topic than it currently is in the I–O journals. What does the limited publication of this type of research say about our field and its contribution toward understanding one of our most important constructs?
(b) Whether intelligence as an assessment is being under-employed by practitioners.
(c) Whether intelligence as a concept is not well being discussed in classes and in text books.
Your concern is, of course, (c). It would be interesting to know how (c) relates to (a) and (b), but I appreciate that that question falls outside of the scope of the paper. In general, I feel that this is a worthwhile paper which deserves publication.
I have a few quibbles and comments, however.
(P1) The discussion of FSIQ (a measure/manifest variable), g (a construct/latent variable), and intelligence (a concept which, in IO, either refers to stratum III in the hierarchy of cognitive abilities or to cognitive abilities in general) is less than perfectly clear. This is perhaps unavoidable given the condensed discussion.
This issue does not have bearing on the main point of the paper since the concern is whether FSIQ/GMA/GCA/g is given its due relative to other constructs. I just make note of the matter. I can discuss specific statements and transitions that I found to be less than crystal clear, if the author wishes. To restate, I am just offering my impression here, not requesting any changes.
(P2) The authors state:Agreement now exists regarding the factorial structure of human mental abilities: The Cattell-Horn-Carroll (CHC) theory of intelligence (Carroll, 1993; McGrew, 2009).
I am not aware of a survey which shows this. I would rephrase the sentence along the lines of Lievens and Reeve (2012):Most experts today accept some form of a hierarchal model, with a single general cognitive ability factor at the apex (referred to as ‘‘g’’ or ‘‘general mental ability’’) in large part due to the exhaustive work of John Carroll (1993).
This is a safer statement since there are multiple models in which g is at the apex e.g., VPR and it is seemingly not established that "most" agree with the CHC one.
(P3) The authors state:Consider the following three quotations, each from a different OB textbook:
--Thus, managers must decide which mental abilities are required to successfully perform each job. For example, a language interpreter…would especially need language fluency (Gibson, et al., 2012, p. 90).
--Different jobs require various blends of these [mental] abilities. As some obvious examples, writers have to be adept at word fluency, statisticians have to be good at numerical ability and numerical reasoning, and architects have to be skilled at spatial visualization (Greenberg, 2013, p. 131)."
Though misleading, I am not sure that these first two statements are in fact incorrect. Imagine that I stated, "Above and beyond g, managers must decide which specific mental abilities are required to successfully perform each job." Would you say that this was incorrect, given that specific abilities do contribute some above and beyond general ability? If not then (1) (as quoted) is not. The same can be said for (2). (I do not have the full quotes, of course.) I agree that the third statement is incorrect because of the condition "as long as". Perhaps you can find more clearly erroneous statements.
(P4) You do not mention if the textbooks are at the undergraduate or graduate level. If the concern is with how IO practitioners -- who would have graduate degrees -- view IQ, this distinction is relevant. Please clarify.
(P5) Regarding the analysis, could you give a couple of examples of paragraphs/excerpts at least in the supplementary/excel file?
e.g., example excerpt -- reason coded thusly.
This gives readers/researchers a better sense of how you grade the paragraphs and what you deem to be accurate/critical, etc. This is important as perspectives may differ. For example, I would not have considered statements (1-2) in (P3) strictly to be inaccurate (as opposed to being incomplete).
Please address P2, P3, P4, P5. I have no other comments. Thank you for your submission.
--John
References:
Hanges, P. J., Scherbaum, C. A., Goldstein, H. W., Ryan, R., & Yusko, K. P. (2012). I–O Psychology and Intelligence: A Starting Point Established.Industrial and Organizational Psychology, 5(2), 189-195.
Lievens, F., & Reeve, C. L. (2012). Where I–O psychology should really (re) start its investigation of intelligence constructs and their measurement.Industrial and Organizational Psychology, 5(2), 153-158.
Miele, F. (2002). Intelligence, race, and genetics: Conversations with Arthur R. Jensen. Westview Press.
Scherbaum, C. A., Goldstein, H. W., Yusko, K. P., Ryan, R., & Hanges, P. J. (2012a). Intelligence 2.0: Reestablishing a research program on g in I–O psychology. Industrial and Organizational Psychology, 5(2), 128-148.
Thanks John. I'll have a full reply later, but I wanted to make this point before heading off to work (regarding "accuracy" / your P3).
A much longer version of this paper was rejected at multiple management education journals. To argue against those quotes, we had the following:
"IQ test scores robustly predict job performance. Indeed, from a scientific perspective, one no longer needs job analysis when predicting job success from IQ test scores (Schmitt & Hunter, 1998). With meta-analysis, the stage was set to falsify the specificity doctrine. After roughly three decades of accumulated research data, Schmidt and Hunter (2004) concluded:
It has been found that specific aptitude tests measure GMA [i.e., g]. In addition to GMA, each measures something specific to that aptitude (e.g., specifically numerical aptitude, over and above GMA). The GMA component appears to be responsible for the prediction of job and training performance, whereas the factors specific to the aptitudes appear to contribute little or nothing to prediction. (p. 167)
Likewise, Gottfredson (2002) summarized this literature thusly:
(1) Specific mental abilities (such as spatial, mechanical or verbal ability) add very little beyond g to the prediction of job performance. g generally accounts for at least 85-95% of a full mental test battery’s (cross-validated) ability to predict performance in training or on the job. (p. 342)
(2) Tests of specific aptitudes…seldom add more than .01 to .03 to the prediction of job performance beyond g…The finding should not be surprising in view of the…“positive manifold.” (p. 350)
(3) The point is not that g is the only mental ability that matters. It is not. Rather, the point is that no other well-studied mental ability has average effect sizes that are more than a tiny fraction of g’s (net of their large g component), and none has such general effects across the world of work. (p. 351)"
In this context, we'd argue that the textbook quotes are indeed inaccurate.
I'm not sure it's worth putting this section back in though unless you find it helpful.
eta. Also, we included generic examples of "accurate" and "critical" in the version here:
Examples of accurate / inaccurate coverage of IQ included mention that it is a strong predictor of job performance, versus mention that specific mental abilities predict better. Examples of accurate / inaccurate coverage of EQ included mention of its criterion validity, versus mention that it predicts job performance better than does g.
Given this, would you still prefer we get back into the texts and place specific quotes for some of the items?
While non-GCA abilities generally do not have much predictive power for job performance, ability tilt seems to be a decent predictor of occupations and majors. This perhaps reflects more interests than abilities. Here's a recent paper on this matter:
Coyle, T. R., Snyder, A. C., & Richmond, M. C. (2015). Sex differences in ability tilt: Support for investment theory. Intelligence, 50, 209-220.
As an example where non-GCA ability was found to have predictive power, see :
Deary, I. J., Strand, S., Smith, P., & Fernandes, C. (2007). Intelligence and educational achievement. Intelligence, 35(1), 13-21.
Where a verbal residual non-GCA factor (?) had predictive power of .22 for English, but .00 for Math.
Still, the predictive ability of GCA factor was ~.69 here, and the non-GCA residual/factor was .13, or a ratio of 5.3/1.
While non-GCA abilities generally do not have much predictive power for job performance, ability tilt seems to be a decent predictor of occupations and majors. This perhaps reflects more interests than abilities. Here's a recent paper on this matter:
Coyle, T. R., Snyder, A. C., & Richmond, M. C. (2015). Sex differences in ability tilt: Support for investment theory. Intelligence, 50, 209-220.
As an example where non-GCA ability was found to have predictive power, see :
Deary, I. J., Strand, S., Smith, P., & Fernandes, C. (2007). Intelligence and educational achievement. Intelligence, 35(1), 13-21.
Where a verbal residual non-GCA factor (?) had predictive power of .22 for English, but .00 for Math.
Still, the predictive ability of GCA factor was ~.69 here, and the non-GCA residual/factor was .13, or a ratio of 5.3/1.
I don't deny the above, but we're talking specifically about job performance (versus career entry or educational achievement) here, and the meta-analytic literature on it seems clear.
Still we can tone down the wording re "accurate" if you all feel it's appropriate.
I am okay with the wording as it is. I have already approved the paper. In my opinion, peer review should not so much concern these judgment calls and interpretation and more concern the analytic methods. I have covered the analyses in detail and they seem to be correct. The scoring and interpretation of the text places are more a matter of judgment call.
One thing thought. The inter-rater reliability correlation. The raw data to calculate this is not given. Do you still have it?
One thing thought. The inter-rater reliability correlation. The raw data to calculate this is not given. Do you still have it?

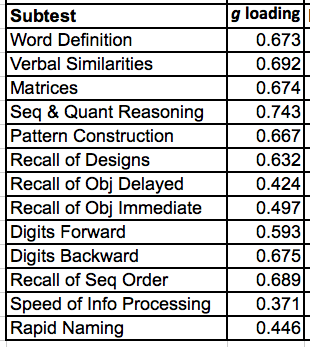
© Copyright 2026 OpenPsych - All Rights Reserved