Title:
Immigrant GPA in Danish primary school is predictable from country-level variables
Authors:
Emil O. W. Kirkegaard
Abstract:
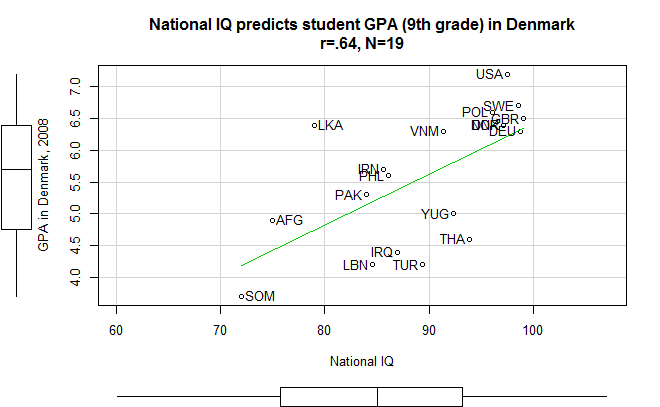
I found immigrant GPA by mother's country of birth in a report from 2011. Correlation analyses shows that it is highly predictable from country-level variables: National IQ (.64), age heaping 1900 (.53), Islam prevalence (-.75), average years of schooling (.74) and general socioeconomic factor (S) in both Denmark (.87) and internationally (.68).
Files.
Back to [Archive] Post-review discussions
Some errors below :
In general, area is a vague term to me. Country would have sufficed.
Finally, when you mention Malloy, you should probably cite a reference. Fuerst used L&V with Malloy's correction to L&V in one of his first papers for ODP. You can cite it.
When you do correlation, I suggest you talk some more about normality on your data. You rarely do that. You can easily make histogram, stem-and-leaf, P-P and Q-Q plot on R. And remember that outliers can be very influential when sample size is small.
Correlation analyses shows that it is highly predictable from country-level variables:
In general, area is a vague term to me. Country would have sufficed.
which on page 13 lists the grade point average (GPA) of children by their mother's birth country/area.
Finally, when you mention Malloy, you should probably cite a reference. Fuerst used L&V with Malloy's correction to L&V in one of his first papers for ODP. You can cite it.
When you do correlation, I suggest you talk some more about normality on your data. You rarely do that. You can easily make histogram, stem-and-leaf, P-P and Q-Q plot on R. And remember that outliers can be very influential when sample size is small.
I posted a scatterplot of GPA and IQ on twitter.
Shapiro test fails to reject the GPA as non-normal.
But histogram shows that it is not very normal looking.
-
The reason to use "area" or "region" is that two of the origin 'countries' are not countries, they are groups based on the remaining countries.
-
I have fixed the grammar error. I will wait with posting the updated version until you have clarified what you want me to write about the normality.
> shapiro.test(unlist(GPA))

	Shapiro-Wilk normality test

data:  unlist(GPA)
W = 0.9251, p-value = 0.1409
Shapiro test fails to reject the GPA as non-normal.
But histogram shows that it is not very normal looking.
-
The reason to use "area" or "region" is that two of the origin 'countries' are not countries, they are groups based on the remaining countries.
-
I have fixed the grammar error. I will wait with posting the updated version until you have clarified what you want me to write about the normality.
You know that I always hated significance test. S-W is useless because when N is large, the p-value will always be lower than 0.05, let alone the problem of arbitrary cut off values for significance. I don't understand why you keep using it. I will never approve a paper that uses S-W to examine normality, instead of histogram, P-P and Q-Q plots. As I said, look at histogram, P-P plot and Q-Q plot. That's all you need. If you don't want to display all the graphs but only one, I think you should probably select histogram.
By the way, If my memory is correct, the spatial transferability theory states that immigrant IQ will stay the same, and that the country of origin will predict test performance. Your paper says the result is consistent with ST theory, but it's just a correlational analysis, so it's only about the second prediction of the theory.
By the way, If my memory is correct, the spatial transferability theory states that immigrant IQ will stay the same, and that the country of origin will predict test performance. Your paper says the result is consistent with ST theory, but it's just a correlational analysis, so it's only about the second prediction of the theory.
You know that I always hated significance test. S-W is useless because when N is large, the p-value will always be lower than 0.05, let alone the problem of arbitrary cut off values for significance.
It will only be so if the data is non-normal. Of course, if N is very large (e.g. 10k), then even a very slight deviation from normality will cause p to be lower than .05 or .01. Instead of looking at the p value, you can look at the W value, which is a measure of normality. It is only .93 for these data. Usually, it is close to .99 when the data looks normal.
Try:
x = rnorm(5000)
shapiro.test(x)

>Shapiro-Wilk normality test

data:  x
W = 0.9997, p-value = 0.8392
You see that W is very close to 1, and p is high even though N=5000 (the function in R is limited to N=5k for some odd reason).
I don't understand why you keep using it. I will never approve a paper that uses S-W to examine normality, instead of histogram, P-P and Q-Q plots. As I said, look at histogram, P-P plot and Q-Q plot. That's all you need. If you don't want to display all the graphs but only one, I think you should probably select histogram.
Because it gives a numerical estimate of the normality of the data. Eye-balling cannot do that. So e.g. if one wants to compare 100 samples automatically for which one is the most normal, one will need a test.
By the way, If my memory is correct, the spatial transferability theory states that immigrant IQ will stay the same, and that the country of origin will predict test performance. Your paper says the result is consistent with ST theory, but it's just a correlational analysis, so it's only about the second prediction of the theory.
If the IQs changed, but stayed in the same relative order, then correlation analysis will not detect it, that's right. ST hypothesis says they will generally stay the same, which also implies the order will stay generally the same, and for this reason the usual correlates of IQ will be found.
It will only be so if the data is non-normal.
Of course not. I saw it many times my variables normally distributed when looking at histogram and P-P plot, and yet S-W says otherwise. Like i said: it's p-value. Your argument is similar as saying that if p is significant, it can only be so if the effect size is large. Yet that is not true, and a lot of examples show that the effect size can be close to zero but p is significant. One example you have is from Pekkala Kerr et al. (2013) "School tracking and development of cognitive skills". They say that schooling reform shows no transfer effect, just because some tests are significantly improved, and others not. But when you calculate effect sizes, which they don't, the d gaps are between 0.00 and 0.03 (or 0.04). In my opinion, it's not different than to say the effect size is zero for each test.
It's dangerous to use significance tests. I always said it, and I will always repeat it.
And even if you trust W value, I don't trust cut off values. What is the .99 really means, given the operation to get W value, which is given here ?
So, what does that mean when you have 0.95 or 0.96 instead of 0.99 ? How can you judge that ? If you think eye-balling is not nice, I will say cut-off values are not better.
If the IQs changed, but stayed in the same relatively order, then correlation analysis will not detect it, that's right. ST hypothesis says they will generally stay the same, which also implies the order will stay generally the same, and for this reason the usual correlates of IQ will be found.
If IQ changes and rank order are not the same thing, and you see that rank order remains the same, you cannot conclude that IQ has not changed. This should be made clear.
---
I don't mind if you use both S-W and histograms/plots. But make sure you don't rely on p values.
Of course not. I saw it many times my variables normally distributed when looking at histogram and P-P plot, and yet S-W says otherwise. Like i said: it's p-value. Your argument is similar as saying that if p is significant, it can only be so if the effect size is large. Yet that is not true, and a lot of examples show that the effect size can be close to zero but p is significant. One example you have is from Pekkala Kerr et al. (2013) "School tracking and development of cognitive skills". They say that schooling reform shows no transfer effect, just because some tests are significantly improved, and others not. But when you calculate effect sizes, which they don't, the d gaps are between 0.00 and 0.03 (or 0.04). In my opinion, it's not different than to say the effect size is zero for each test.
The p value will only go down if the data are non-normal. With large N's, even a slight deviation from normality will cause a low p value. However, merely using a large N is not sufficient, as I just showed with code above (N=5000).
My argument is not one of the fallacies which is you discuss, where authors reason from "significant p value" to "real-world significance" or from "non significant p-value" to "no effect".
It's dangerous to use significance tests. I always said it, and I will always repeat it.
And even if you trust W value, I don't trust cut off values. What is the .99 really means, given the operation to get W value, which is given here?
So, what does that mean when you have 0.95 or 0.96 instead of 0.99 ? How can you judge that ? If you think eye-balling is not nice, I will say cut-off values are not better.
W = 1 perfect normality. Any value below it indicates non-normality. We can simulate datasets, so one can get a feel for the different values of W and how the data looks like. I did a little write-up here: http://emilkirkegaard.dk/en/?p=4452
As you can see from my simulations, W values do not change much as long as the distribution is reasonably normal. It was hard to get it below .95. Of course, when examining small datasets, such as the GPA one (N=19), sampling error can result in low W values even tho the population GPA distribution is normal (or normalish).
In the case of GPA here, however, it is not very normal. I tried log-transforming it, but it is slightly less normal after that (Ws .9251 before, .9124 after). What do you want me to do with it?
One idea is to use Spearman's rho instead.
The results however, are pretty much the same:
The results however, are pretty much the same:
Variable                                      rho with GPA P value  N
S.factor.in.Denmark.Kirkegaard2014          0.87  0.0000 18
IslamPewResearch2010                       -0.75  0.0003 18
LV2012estimatedIQ                           0.64  0.0034 19
AverageYearsOfEducation2010                 0.74  0.0004 18
AH1900                                      0.53  0.0522 14
International.S.Factor.Kirkegaard2014       0.68  0.0052 15
The p value will only go down if the data are non-normal.
First, you say that p goes down only if the variable is not normally distributed. Then, you say it can go down if N is large (and you show it in your blog post). So, it's not "only if" the variabe is not normal. That's the problem I always pointed out.
In the case of GPA here, however, it is not very normal. I tried log-transforming it, but it is slightly less normal after that (Ws .9251 before, .9124 after). What do you want me to do with it?
Sometimes, transformation does not work because the data follows a specific distribution (e.g., poisson). In such a case, use poisson regression. Sometimes, the data is truncated or censored. Then use truncated or tobit regression. You have used Spearman's rho, and it is a valid test here, given your histogram. But sometimes, even Spearman's test is not appropriate. Like I said, when you have censored, truncated or poisson distribution. Just because the data is not normal does not mean Spearman's test is the most appropriate solution. But of course, you can't see that with your S-W test. That's why I prefer histogram. S-W test cannot even tell anything about skewness and kurtosis. But histogram can do that. When you look only at S-W test, you will come to the conclusion that the data is not normal, and that Pearson's test is not appropriate. Correct. But when it comes to choose the best method, S-W fails badly. It cannot show you which method to apply.
For your article anyway, I will only ask that you note the data is not normally distributed, as indicated by histogram (and S-W test if you really want it) and then show that Spearman's correlation produces the same result. And I will approve. I don't think the analysis needs to be carried out even further. And I don't even have ideas. Pearson/Spearman is just sufficient.
First, you say that p goes down only if the variable is not normally distributed. Then, you say it can go down if N is large (and you show it in your blog post). So, it's not "only if" the variabe is not normal. That's the problem I always pointed out.
You have not read carefully enough. I said that it goes down when both of two conditions are met: 1) there is nonnormality in the data, 2) N is large. Condition (2) is not sufficient in itself, as I clearly showed by simulation.
But of course, you can't see that with your S-W test. That's why I prefer histogram. S-W test cannot even tell anything about skewness and kurtosis. But histogram can do that. When you look only at S-W test, you will come to the conclusion that the data is not normal, and that Pearson's test is not appropriate. Correct. But when it comes to choose the best method, S-W fails badly. It cannot show you which method to apply.
SW is not a tests of whether Spearman's method is the right. It is a test of normality. You wouldn't criticize IQ tests for not measuring height either.
S-W test cannot even tell anything about skewness and kurtosis.
Same as above. Just use describe() for that. Skew is -.3 and kurtosis is -1.39.
For your article anyway, I will only ask that you note the data is not normally distributed, as indicated by histogram (and S-W test if you really want it) and then show that Spearman's correlation produces the same result. And I will approve. I don't think the analysis needs to be carried out even further. And I don't even have ideas. Pearson/Spearman is just sufficient.
I will update it with a histogram + Spearman's results later today. :)
I don't understand your comment. I said that histogram displays much more information than S-W, and that if you would ask me which method I prefer, it's clearly histogram. By far. For example, only histogram can tell you if techniques like poisson regression should be conducted. And that is a common pattern in crime/delinquency data, where you usually have things like : 90% with zero occurrence, 5% with 1 occurrence, 3% with 2 occurrences, 2% with 3+ occurrences.
I know that you like histograms, but they are balling on subjective analysis. Eye-balling is not good at telling whether a distribution is very unlikely to be caused by chance (low p value).
Histograms are of course useful for deciding which analysis method to use in some cases (when N isn't small), as you say.
I didn't have time to update it apparently, I will do it now.
Histograms are of course useful for deciding which analysis method to use in some cases (when N isn't small), as you say.
I didn't have time to update it apparently, I will do it now.
Ok, here's a new revision, #3. https://osf.io/p9d5z/
It has some language changes, histogram, Spearman's correlations.
The reason I stopped using Spearman's correlations is that Pearson's cors are not very sensitive to violation of normality. Spearman and Pearson cors are almost always the same.
It has some language changes, histogram, Spearman's correlations.
The reason I stopped using Spearman's correlations is that Pearson's cors are not very sensitive to violation of normality. Spearman and Pearson cors are almost always the same.
So you have made the changes concerning the citation of Malloy's data, added the histogram and Spearman's correlation. I have nothing more to add.
I approve.
---
A little word about referencing.
For example,
[5] Emil O. W. Kirkegaard. Predicting Immigrant IQ from their Countries of Origin, and Lynn's National IQs: A Case Study from Denmark. Mankind Quarterly, 2013.
In all your publications, you usually cite like this, "Emil" first and then "Kirkegaard". In other articles, the order would have been reversed. And in general, I think people would look for "Kirkegaard" if they want to look for your name. So, using "Emil" first does not really help the research. Not for me, at least.
The references come in the order they are cited in. The names come in their ordinary order which I prefer over surname-first approach.
When using APA-style, references are ordered by author surnames instead of order of citation. Most of my papers are written in LATEX with the Vancouver style (numbered), not APA. When it's APA, it's because it's handwritten or not primarily written by me (e.g. Dutton and Kirkegaard, Fuerst and Kirkegaard, Piffer and Kirkegaard papers).
When using APA-style, references are ordered by author surnames instead of order of citation. Most of my papers are written in LATEX with the Vancouver style (numbered), not APA. When it's APA, it's because it's handwritten or not primarily written by me (e.g. Dutton and Kirkegaard, Fuerst and Kirkegaard, Piffer and Kirkegaard papers).
I have forgotten to mention something. Outliers may be a problem in small sample size. But Spearman's rho is robust against it. You can add this information.
Spearman's is not robust against outliers I think.
I have seen it many times in books that Spearman's rank correlation is "robust" or "more robust" against outliers. Jensen also used rho several times to check for the influence of possible outliers when he performs MCV.
Since r_s is just correlation on rank-orders, it is not sensitive to any change in values that does not result in a rank-order change. In that sense, it is more robust than Pearson's. See e.g. https://en.wikipedia.org/wiki/Spearman%27s_rank_correlation_coefficient#mediaviewer/File:Spearman_fig3.svg
The new immigration report has come out. Every year the Danish Statistics Agency releases a report on immigration in Denmark. This year they have included quite a lot of more useful data. As a new thing, it includes GPAs for some countries of origin, but only for a small number and only for second generation. I will update the paper with these new data and analyses of them.
http://www.dst.dk/da/Statistik/Publikationer/VisPub.aspx?cid=19004
http://www.dst.dk/da/Statistik/Publikationer/VisPub.aspx?cid=19004

© Copyright 2026 OpenPsych - All Rights Reserved